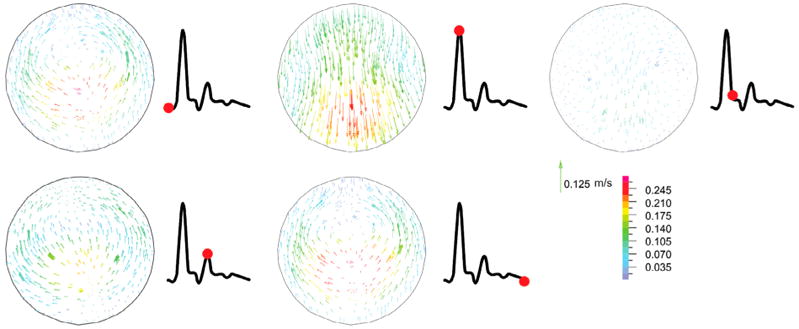
Figure 8.

Velocity vectors for the aneurysmal carotid artery under pulsatile flow with a stretch ratio of 1.5 and lumen pressure of 130 mmHg at the maximum deflection area sections through the different phases of the cardiac cycle (at time t = 0.07, 0.18, 0.33, 0.49, and 1 s, respectively). The red point on the black line graph shows the respective time instant on the velocity curve.
