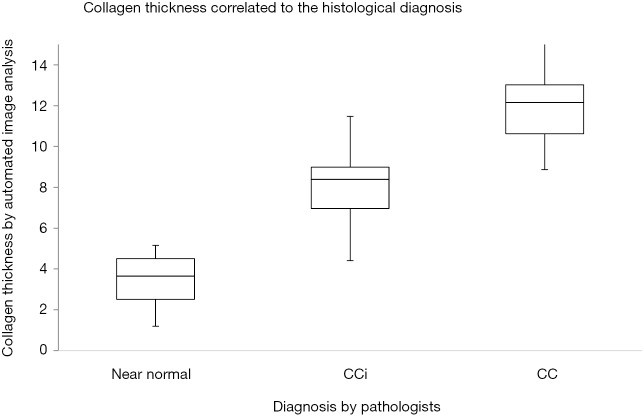
Figure 5.
Thickness of collagen band (µ) assessed by automated image analysis compared to the histological diagnosis of the pathologists (CC, CCi and near normal). Horizontal lines represent median value, boxes represent 25–75% intervals and the vertical lines the minimum and maximum value. CCi, collagenous colitis incomplete; CC, collagenous colitis.

