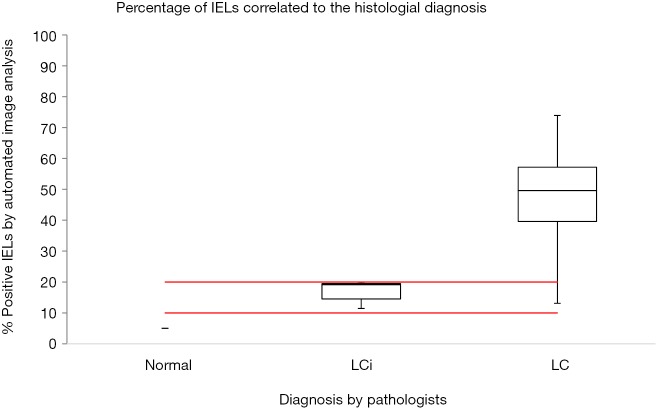
Figure 6.
Number of intraepithelial lymphocytes (IELs) assessed by automated image analysis compared to the histological diagnosis of the pathologists (LC, LCi and normal). Red horizontal lines mark the cut off values that split the diagnostic categories into LC, LCi and normal. Black horizontal lines represent median value, boxes represent 25–75% intervals and the vertical lines the minimum and maximum value. The line at “Normal” represent the two cases of normal biopsies had accidently been included in the material. LCi, lymphocytic colitis incomplete; LC, lymphocytic colitis.

