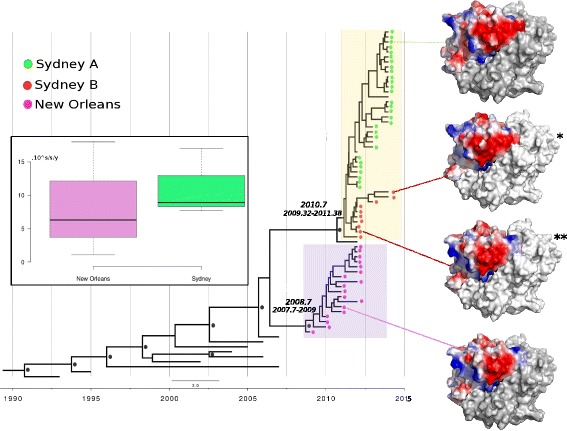
Fig. 5.

Molecular clock phylogeny based on the 58 nucleotide sequence (627 bp) of P2 region (VP1), estimated by uncorrelated log-normal model using the Coalescent Piecewise Bayesian Skyride Plot method with 100 million replicates, from 2010 to 2014 in Amazon, Brazil. The taxa were represented by colored circles according to the GII.4 variant. The most recent common ancestor (TMRCA) of each variant is indicated next to the clade. The black circle represents supported clades (> 95%). Three-dimensional VP1 structure of the GII.4 predicted by homologous modeling based on the crystal structure (PDB number 4OP7) (*) Surface-exposed electrostatic charges showing differences within the Sydney lineage. (**) Surface-exposed electrostatic charges showing a sample clustering with Sydney variant but demonstrating more similarities in the surface protein with New Orleans variant. Boxplot of evolutionary rates of Sydney and New Orleans variants
