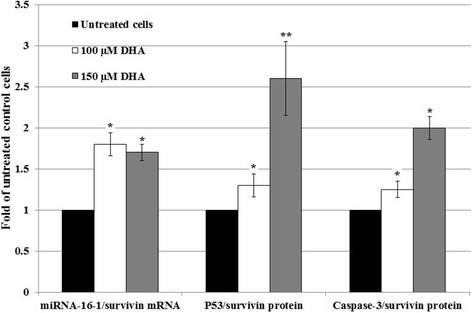
Fig. 8.

Evaluation of the microRNA-16-1/survivin mRNA, p53/survivin, and caspase-3/survivin protein ratios in DHA-treated cells. 5 × 10⁵ HCT-116 cells/well were treated with different DHA concentrations for 48 h and microRNA-16-1, p53, survivin, and caspase-3 expression levels were measured. Thereafter, microRNA-16-1/survivin mRNA, p53/survivin, and caspase-3/survivin protein ratios were calculated. The results were presented as mean ± SD of two independent experiments with triplicate assays. *P < 0.05 and **P < 0.01 vs. untreated control cells
