
Fig. 3.
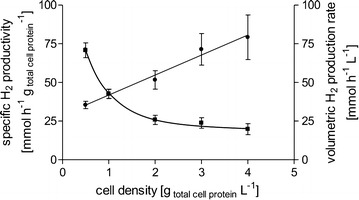
Influence of the cell density on volumetric and specific H2 production rates. Cells were grown with 20 mM fructose, harvested in the exponential growth phase, and suspended in buffer (50 mM imidazole, 20 mM KCl, 20 mM MgSO4, 30 µM ETH2120, 20 mM NaCl, 4 mM DTE, pH 7) to a final protein concentration of 0.5–4 mg mL−1 (corresponding to a CDW of 1.2–9.7 g L−1). Experiments were started by the addition of 100 mM sodium formate. Initial specific H2 production rates (squares) or initial volumetric H2 production rates (circles) are plotted against the cell density used