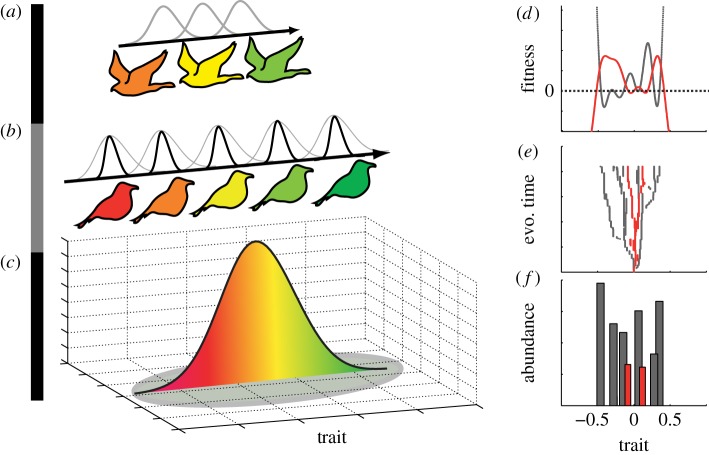
Figure 1.
Model illustration (a–c) and example of model output (d–f). A species pool of top consumers (a) with some trait z (e.g. birds of prey with body size z) and a pool of competitive consumers (b) with trait u (e.g. granivorous birds with beak size u) that interact on an island (c) defined by some implicit resource distribution with peak abundance as uopt and width σK. The three trophic levels are distributed on the same trait dimension (e.g. size) here illustrated by colour. Competition between species is dictated by their niche width (black and grey Gaussian kernels), and we assume that populations with similar traits interact more than less similar ones. The invasion fitness of a mutant is thus a function of its trait-matching to its resources, the traits of its competitors on the same trophic level and their niche widths. We simulate adaptive radiations (e) and community data (f) with the assumption of ecological opportunity by seeding the system with monomorphic populations with trait value equal to uopt. From this starting point at each evolutionary time step we computed community equilibrium, we allowed for mutations, computed mutant invasion fitness (d), and we either added the mutant population to the community or replaced the mutating population with the mutant population. Grey and red colour in (d–f) denote data associated with prey and predators, respectively.

