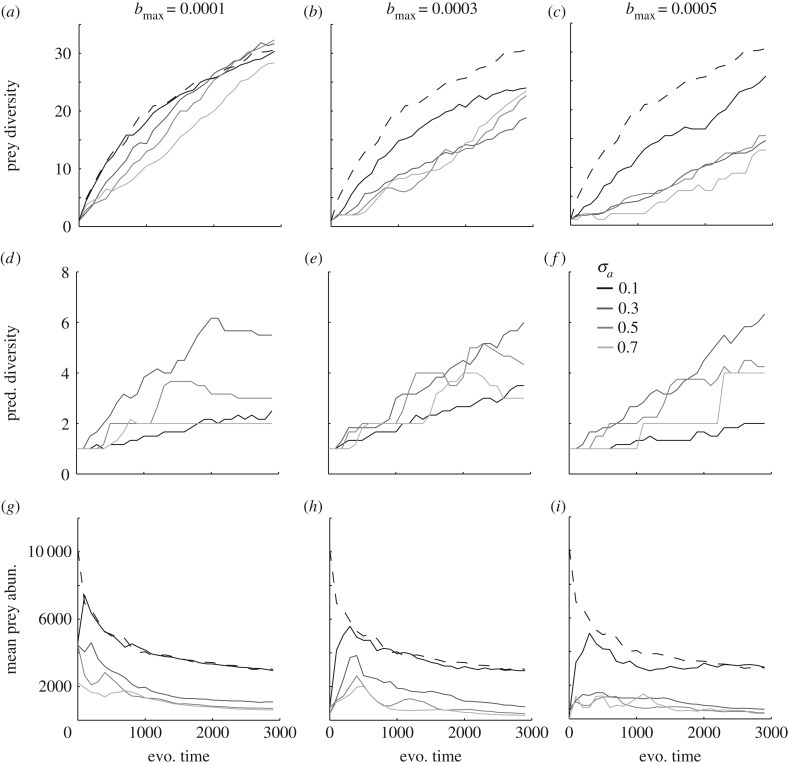
Figure 4.
Predator–prey community adaptive radiation data. Prey diversity (mean over 5 replicated simulations) and diversification rate are in general lower in predator–prey radiations (solid lines) compared to prey radiations (dashed line) (a–c). Prey diversity and diversification rate are also negatively related to predator niche width and efficiency (a–c). Note the increase in predator efficiency with panel columns. Predators also radiate, and predator diversity is positively related to prey diversity (d–f). Mean prey abundance decreases with evolutionary time, and prey abundance tends to be higher in prey radiations (dashed line) than in predator–prey radiations (solid lines) (g–i). If nothing else is stated parameters and traits were set to: uopt = 0; K0 = 10 000; σK = 1; r = 1; σα = 0.1; d = 0.2; c = 0.3; μpred = 0.01; μprey = 0.01.

