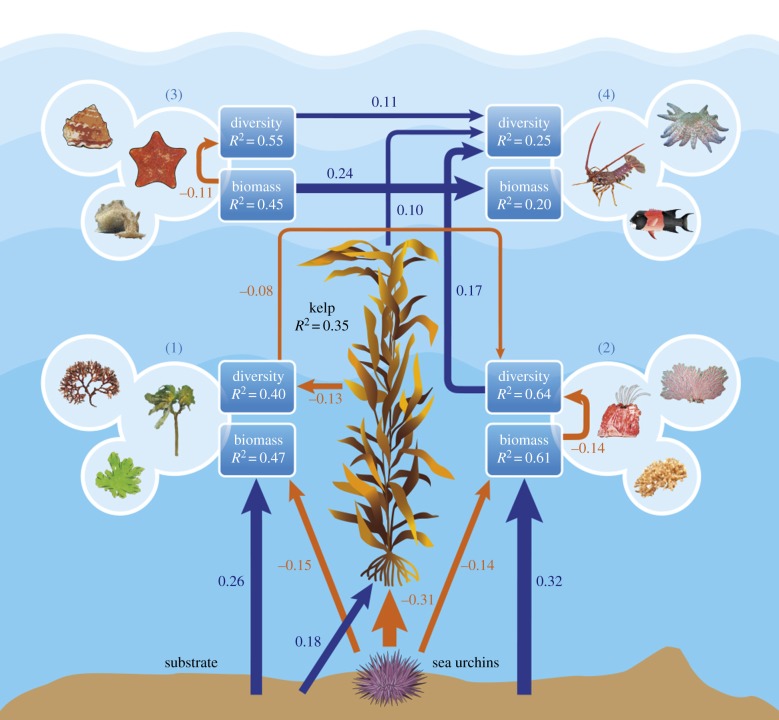
Figure 1.
Piecewise SEM model of the effect of giant kelp biomass and sea urchin biomass on biomass and diversity order 1 (see Material and methods) of four taxonomic functional groups, represented by the blue boxes: (1) understorey macroalgae, (2) sessile invertebrates, (3) mobile grazers and (4) mobile predators. Effects of substrate on the biomass of sessile groups are also shown. Arrows represent unidirectional relationships among variables. Blue arrows denote positive relationships, and orange arrows negative relationships. Arrows for non-significant paths (p ≥ 0.05) are not shown. The thicknesses of the significant paths reflect the magnitude of the standardized regression coefficients given alongside. R2-values inside boxes are conditional R2.

