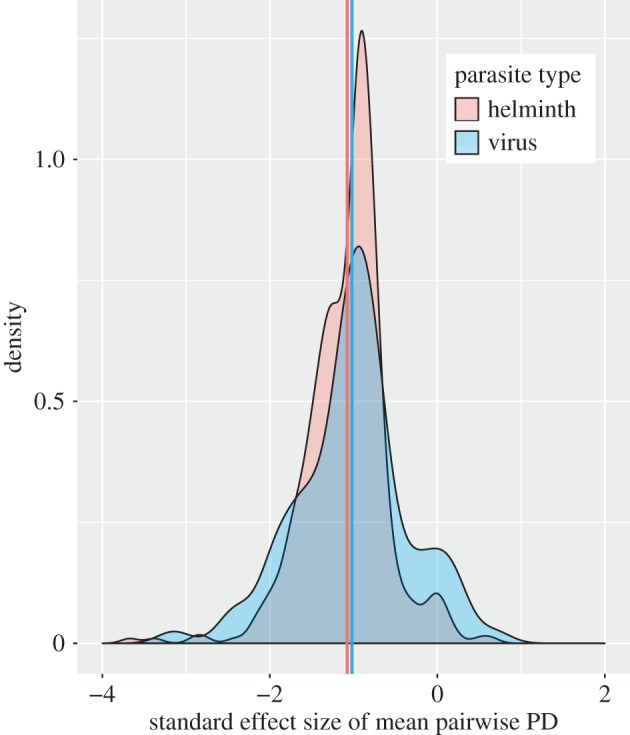
Figure 2.

Probability density function of standard effect size of mean pairwise PD for helminths (red) and viruses (blue). The mean standard effect size is very close between the two types (group mean values denoted by colour-coded vertical lines), but the virus group contains more extreme parasites in terms of both specialism and generalism. The complete density plot for all five parasite types is presented in the electronic supplementary material (electronic supplementary material, figure S7).
