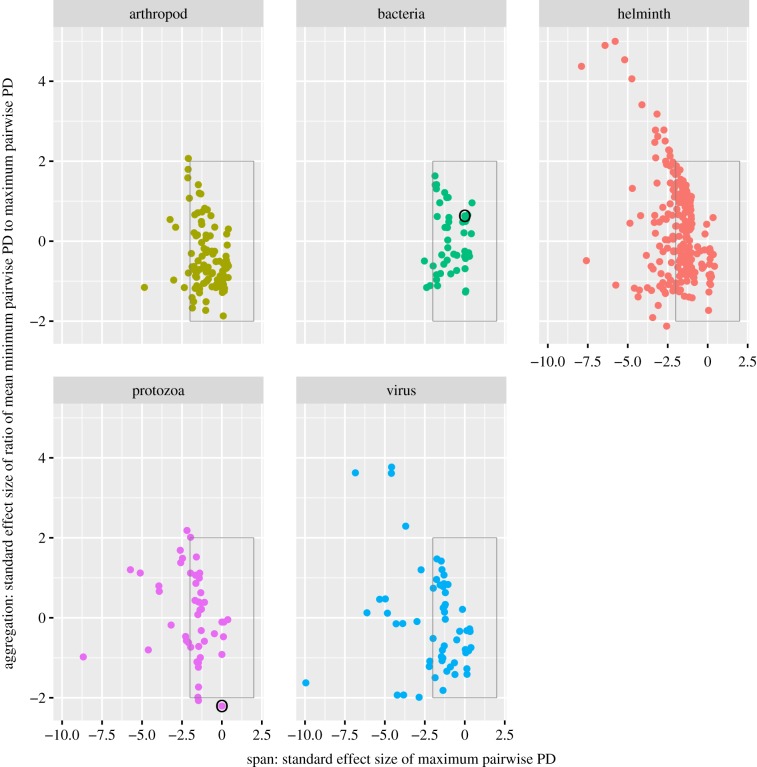
Figure 3.
Scatter plot showing both span and aggregation of parasites by type. The x-axes provide a standard effect size of maximum pairwise PD of a parasite's host set (span) and the y-axes provide a standard effect size of the ratio of mean minimum pairwise PD to maximum pairwise PD (aggregation). Circled bacterial and protozoan parasites are Leptospira interrogans and Trypanosoma cruzi. These parasites have a similar span (x ≈ 0), but very different host aggregation patterns (L. interrogans exhibiting a random distribution of host species, T. cruzi exhibiting an aggregated distribution of host species, illustrated further in figure 4). Boxes encompassing −1.96 < x, y < 1.96 contain parasites whose standard effect sizes are typical of those expected from a random set of hosts. Negative standard effect sizes lower than −1.96 are typical of host sets exhibiting a significantly small span (x-axis) and aggregated distribution (y-axis).

