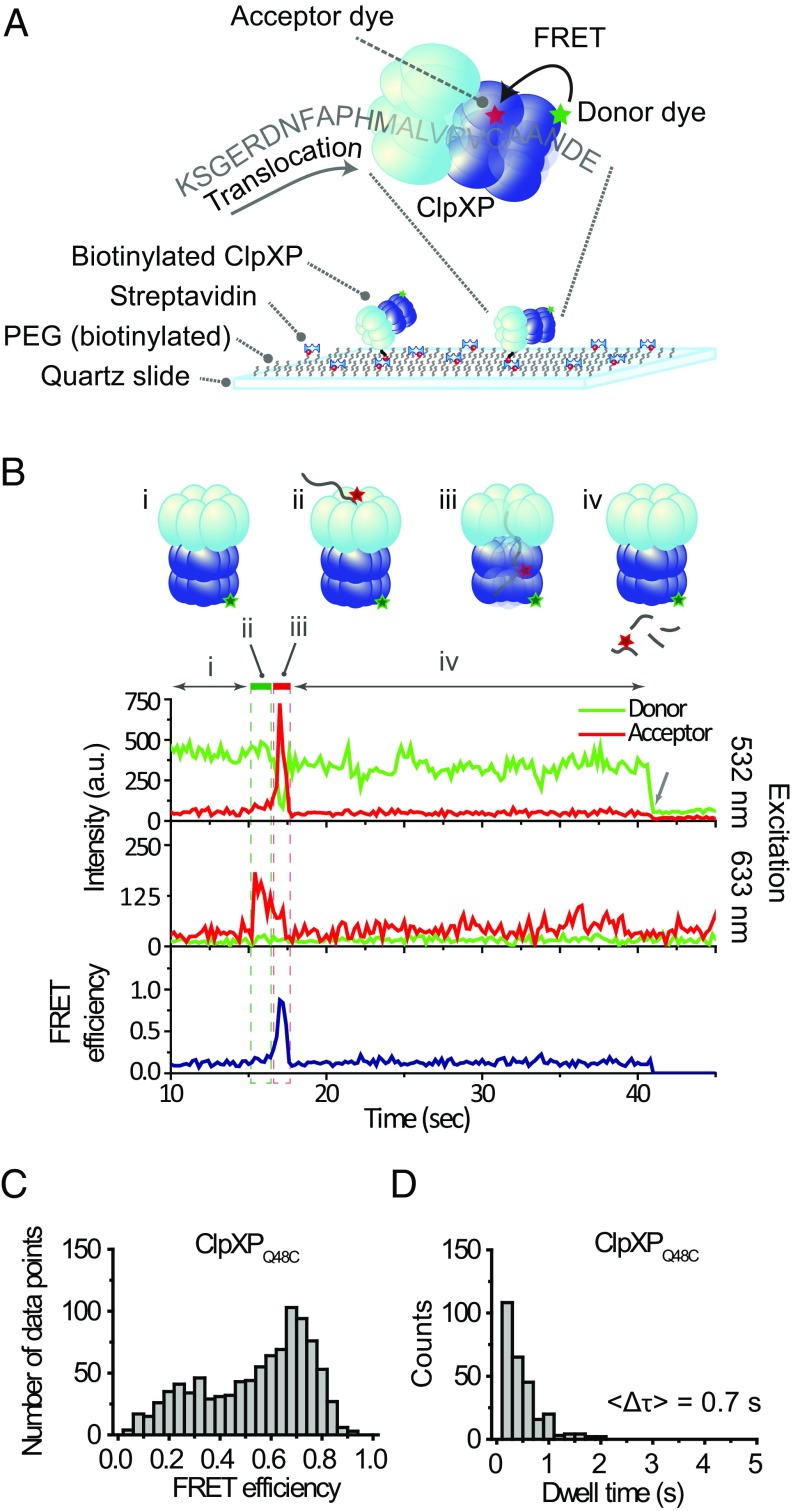
Fig. 1.
Single-molecule observation of ClpXP translocation. (A) Schematics of the single-molecule fingerprinting platform. Donor-labeled ClpXP is immobilized on a PEG-coated slide via biotin–streptavidin conjugation. ClpX6 recognizes an acceptor-labeled substrate (K-38-CCy5-ssrA, Table S1) and translocates it into the ClpP14 chamber, upon which FRET occurs. (B) A typical fluorescence time trace. (i) The donor signal is from Cy3-labeled ClpXP (Top trace) upon green excitation (532 nm). (ii, green box) The sudden appearance of acceptor signal (time ∼16 s) during acceptor-direct excitation with red (633 nm) reports on binding of acceptor-labeled substrate to ClpXP (Middle trace). (iii, red box) The high FRET (time ∼17 s) reports on the presence of the substrate in ClpP14 (Top and Bottom traces). (iv) Loss of fluorescence signal indicates the release of the substrate. The arrow at time ∼40 s indicates the photobleaching of Cy3. (C) FRET distribution of stage iii (n = 239). (D) Dwell time distribution of stage iii (n = 239).

