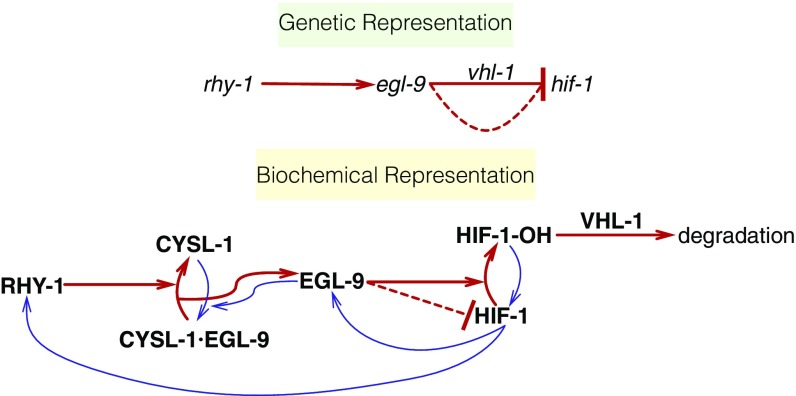
Fig. 1.
Genetic and biochemical representation of the hypoxia pathway in C. elegans. Red arrows are arrows that lead to inhibition of HIF-1, and blue arrows are arrows that increase HIF-1 activity or are the result of HIF-1 activity. EGL-9 is known to exert VHL-1–dependent and –independent repression on HIF-1 as shown in the genetic diagram. The VHL-1–independent repression of HIF-1 by EGL-9 is denoted by a dashed line and is not dependent on the hydroxylating activity of EGL-9. RHY-1 inhibits CYSL-1, which in turn inhibits EGL-9, but this interaction was abbreviated in the genetic diagram for clarity.

