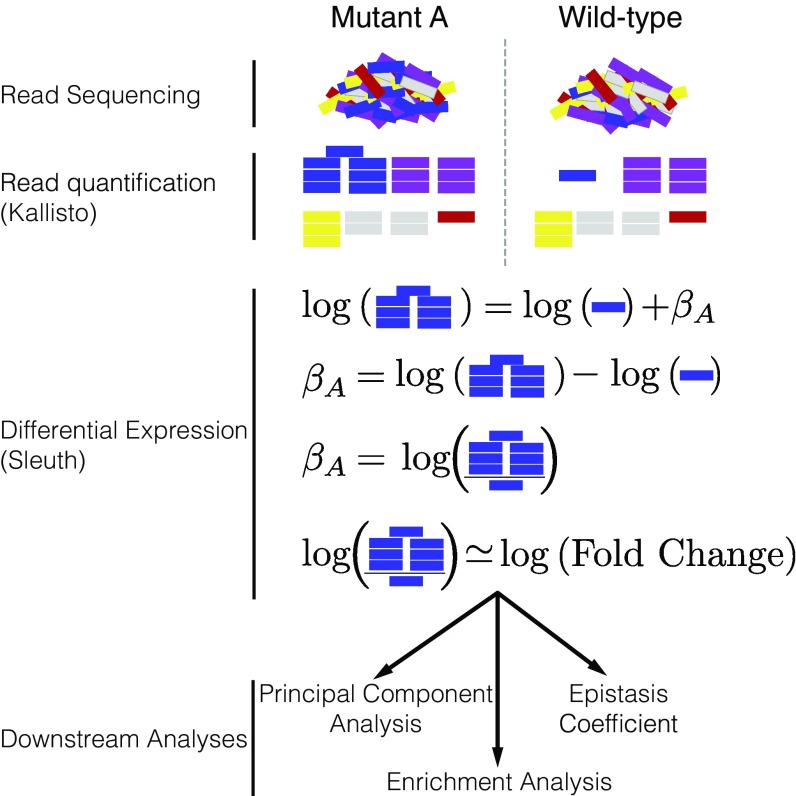
Fig. 2.
Analysis workflow. After sequencing, reads are quantified using Kallisto. Bars show estimated counts for each isoform. Differential expression is calculated using Sleuth, which outputs one coefficient per isoform per genotype. coefficients are analogous to the natural logarithm of the fold-change relative to a wild-type control. Downstream analyses are performed with coefficients that are statistically significantly different from 0. values less than 0.1 are considered statistically different from 0.

