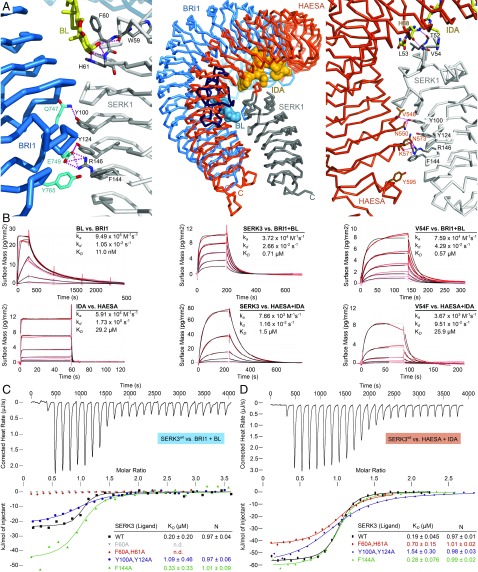
Fig. 1.
Two distinct SERK surface patches contribute to formation of different LRR-RK complexes. (A, Center) Structural superposition of BRI1–BL–SERK1 (PDB ID 4LSX) and HAESA–IDA–SERK1 (PDB ID 5IYX) complex structures, using the SERK1 ectodomain as reference (rmsd is ∼0.6 Å comparing 185 corresponding Cα atoms). Shown are Cα traces of the BRI1 LRR domain (blue, island domain in dark blue), the HAESA LRR domain (orange), the SERK1 ectodomain (gray) and the steroid (blue) and peptide (orange) ligands in surface representation, respectively. (A, Left) Close-up view of the BRI1–BL–SERK1 complex, highlighting the two distinct interaction surfaces and including selected interface interactions. BL is shown in bond representation (yellow). (A, Right) Details of the HAESA–IDA–SERK1 interface, with IDA shown in bonds representation (yellow). SERK residue numbering is according to Arabidopsis SERK3. (B) Grating-coupled interferometry (GCI)-derived binding kinetics for BRI1 and HAESA vs. their ligands and SERK3. Shown are sensorgrams with data in red and their respective fits in black (Materials and Methods). Table summaries of kinetic parameters are shown (ka, association rate constant; kd, dissociation rate constant; KD, dissociation constant). (C) Isothermal titration calorimetry (ITC) of the BRI1 LRR domain vs. wild-type and mutant SERK3 ectodomains and in the presence of BL. (D) ITC of the HAESA LRR domain vs. SERK3 proteins and in the presence of IDA. Table summaries for dissociation constants (KD) and binding stoichiometries (N) are shown (± fitting error; n.d., no detectable binding).

