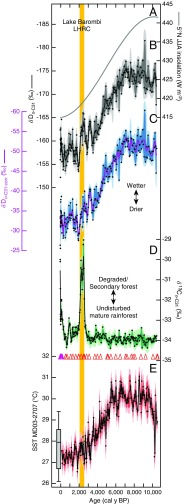
Fig. 2.
Records of environmental change from Lake Barombi over the past 10,500 y and comparison with local summer insolation and Gulf of Guinea SSTs. () Long-term insolation changes at 5°N during Northern Hemisphere summer [June–July–August (JJA)] (40). () Lake Barombi . () Lake Barombi corrected for vegetation changes (). More positive (negative) values indicate drier (wetter) conditions. () Lake Barombi reflecting vegetation changes, namely C3 vs. C4 plant contributions to sediments. values have been corrected for the Suess effect for the last 160 y (SI Appendix). (D, Bottom) Purple and red triangles denote 210Pb and 14C dates, respectively, used in the Lake Barombi age model. () Mg/Ca-derived SST record from core MD03-2707 (41), reflecting ocean temperature changes in the Gulf of Guinea that were reassessed to account for the effect of changing salinity following ref. 42 (SI Appendix). The box plot indicates monthly modern SST values at the core site (43) (box shows the median, 25th and 75th percentiles; error bars are extended to extreme data points). (-) Single data points are denoted as dots; lines indicate median probabilities; envelopes reflect 68% (dark) and 95% (light) confidence intervals in the reconstructions, based on analytical and age model errors. Vertical yellow band indicates the timing of the Lake Barombi LHRC.

