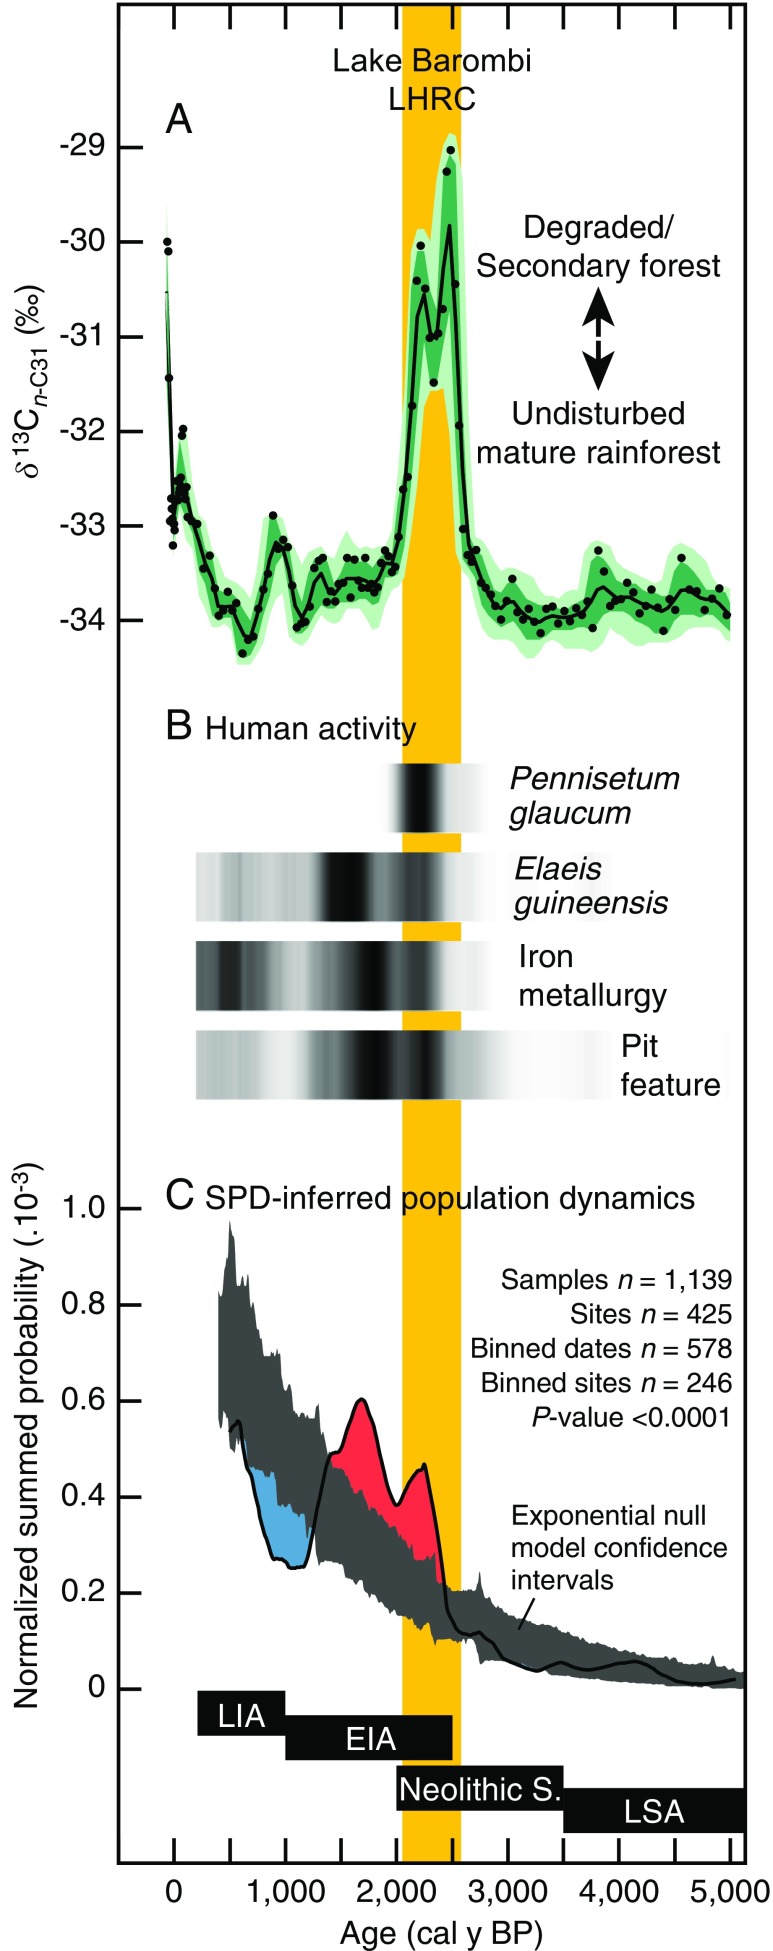
Fig. 4.
Detailed comparison of the Lake Barombi vegetation changes and the archaeological record of WCA during the past 5,000 y. () Lake Barombi indicating vegetation changes. values have been corrected for the Suess effect for the last 160 y (SI Appendix). Dots are the raw measured data; line indicates median probability; envelopes reflect 68% (dark) and 95% (light) confidence intervals in the reconstruction, based on analytical and age model errors. ( and ) Archaeological synthesis of WCA. All presented archaeological data rely on the SPD of calibrated 14C dates that were binned in space using 10-km radii and time using 200-y intervals (SI Appendix). SPDs were plotted with a 200-y moving average to prevent overinterpretation of smaller-scale variability (53–55) and are shown either as a gray scale [() black represents maximum probability, white represents null probability] or as a line (). () Evidence of human activity. () SPD-inferred population dynamics: SPD of 14C dates (thick line) was compared against an exponential model used as a conservative null hypothesis reflecting both the long-term population rise observed in prehistoric populations and temporally increasing taphonomic loss (53–55) (SI Appendix). The dark gray area represents the 95% confidence intervals for the null model. Red and blue areas represent intervals with significant positive and negative deviations, respectively. Regional cultural timeline (13) shown at bottom (EIA, Early Iron Age; LIA, Late Iron Age; LSA, Late Stone Age; Neolithic S., Neolithic Stage). Vertical yellow band indicates the timing of the Lake Barombi LHRC.

