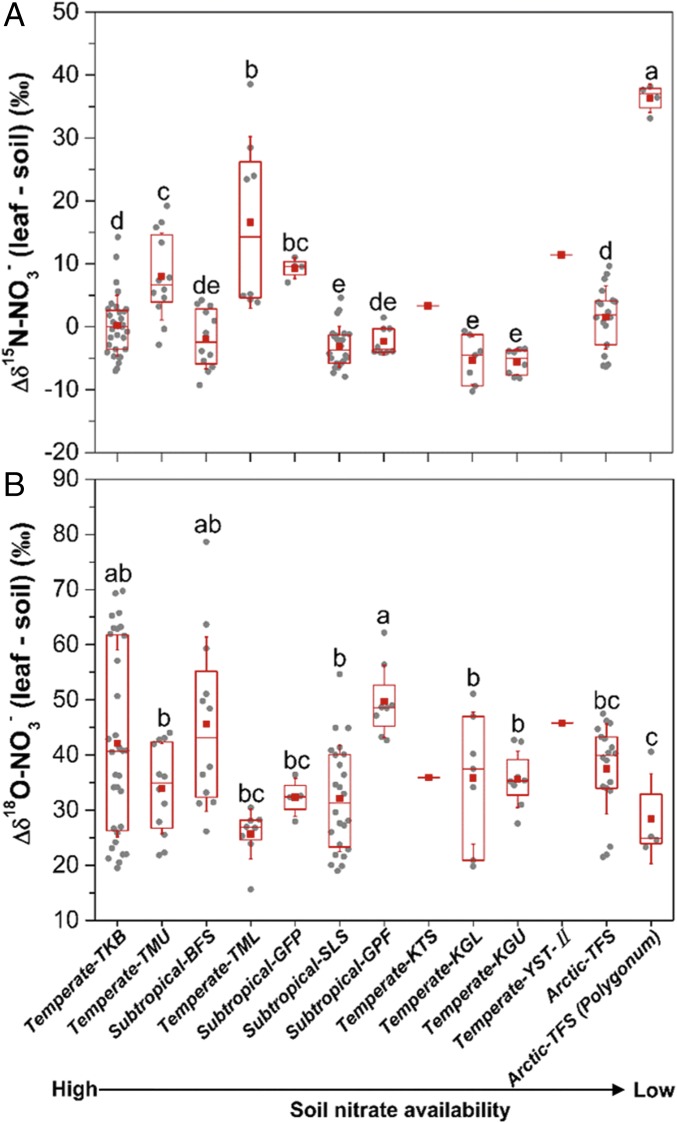
Fig. 2.
Differences (∆ values) in δ15N (A) and δ18O (B) between leaf NO3− and soil NO3− across different ecosystems. The box encompasses the 25th to 75th percentiles, whiskers are the SD values, and the red line and red square in each box mark the median and mean values, respectively. Unique letters above the boxes indicate significant differences at the level of P < 0.05. The ∆ values were calculated using replicate values of plant tissues minus mean values of soil in corresponding sites (SI Appendix, Fig. S8 and Table S1).

