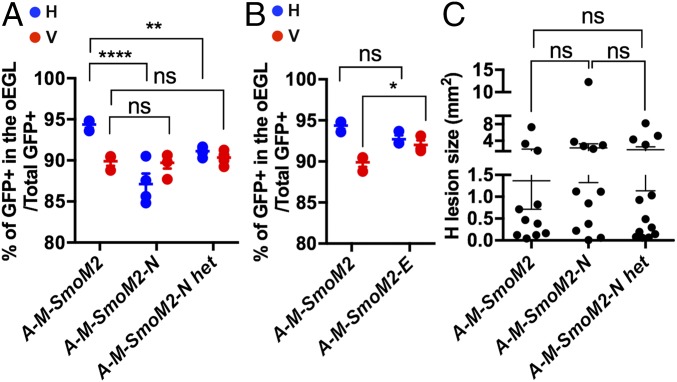
Fig. 6.
Nr2f2 and En1/2 influence the differentiation of SmoM2-mutant P8 GCPs but not tumor formation. (A) Graphs comparing the proportions of undifferentiated GCPs between H and V of A-M-SmoM2 (also shown in Fig. 3A), A-M-SmoM2-N (n = 4), and A-M-SmoM2-N het (n = 5) mice. (B) Graphs comparing the proportions of undifferentiated GCPs between the H and V of A-M-SmoM2 and A-M-SmoM2-E (n = 3) mice. (C) Graphs showing the size of H lesions from A-M-SmoM2 (n = 11), A-M-SmoM2-N (n = 12), and A-M-SmoM2-N het (n = 13). Significances determined using a two-way ANOVA followed by a Sidak post hoc test for A and B, or with a one-way ANOVA followed by Tukey post hoc test for C. All data are expressed as mean ± SEM. ****P < 0.0001, **P < 0.01, *P < 0.05, ns, nonsignificant. Statistics are provided in Table S2.

