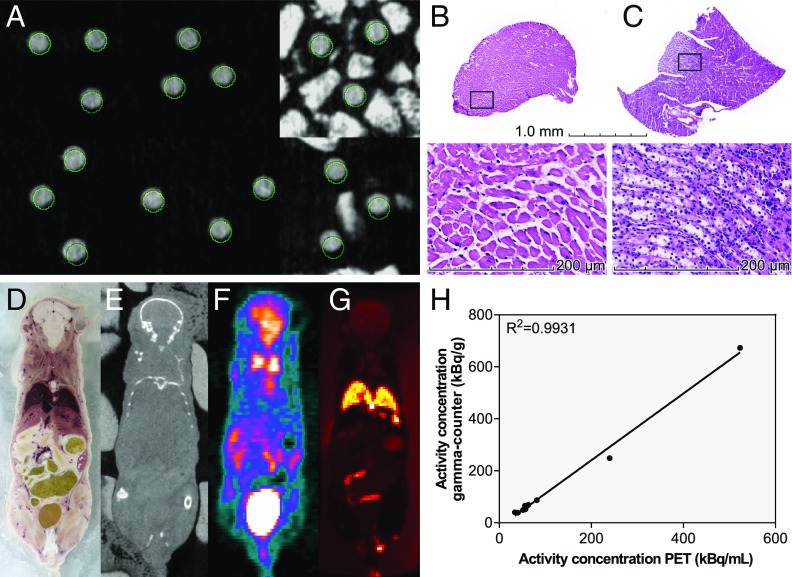
Fig. 3.
Spatial accuracy and planar imaging. (A) CT images acquired postmilling from six mice with three regions each. The VOIs, as defined before milling, are circled in green. (B and C) H&E stains of IGMM-derived tissue samples from a VOI placed in the heart (B) and from a VOI placed in the kidney (C). (D–G) A regular light photograph (adjusted for white-balance and slight geometric distortions) (D), CT (E), PET (F), and OI (G) in a plane through a mouse. D and G were obtained after milling. (H) Activity concentrations obtained with PET and a gamma-counter in 11 cylinders.

