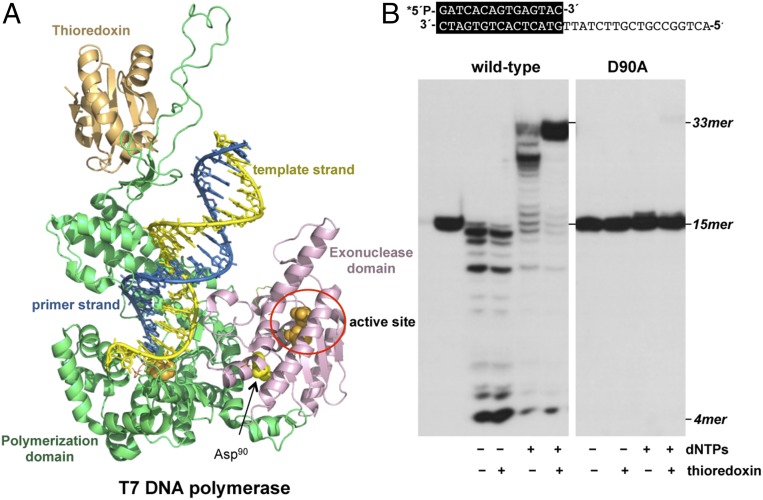
Fig. 6.
(A) Crystal structure of T7 DNAP with the N-terminal 3′-5′ exonuclease domain (residues 1–187) colored in pink, the C-terminal polymerization domain (residues 188–698) colored in green, and thioredoxin colored in orange. Catalytic active site residues from the polymerization and exonuclease domains are shown as orange spheres, whereas Asp90 is represented as yellow spheres (PDB ID code 1TK8) (9). (B) Polymerization and exonuclease activities of wild-type and mutant T7 DNAPs. The assay was performed as described in Materials and Methods using the 5′-labeled primer/template molecule sp1/sp1c+18 (15mer/33 mer) depicted on top of the figure, in the presence (+) or absence (−) of dNTPs and thioredoxin. Polymerization or 3′-5′ exonucleolysis is detected as an increase or decrease, respectively, in the size (15mer) of the 5′-labeled primer. After incubation for 10 min at 30 °C, samples were analyzed by 7 M urea/20% polyacrylamide gel electrophoresis and autoradiography. Asterisk indicates the 5′-32P-labeled end of the primer strand.

