Fig. 3.
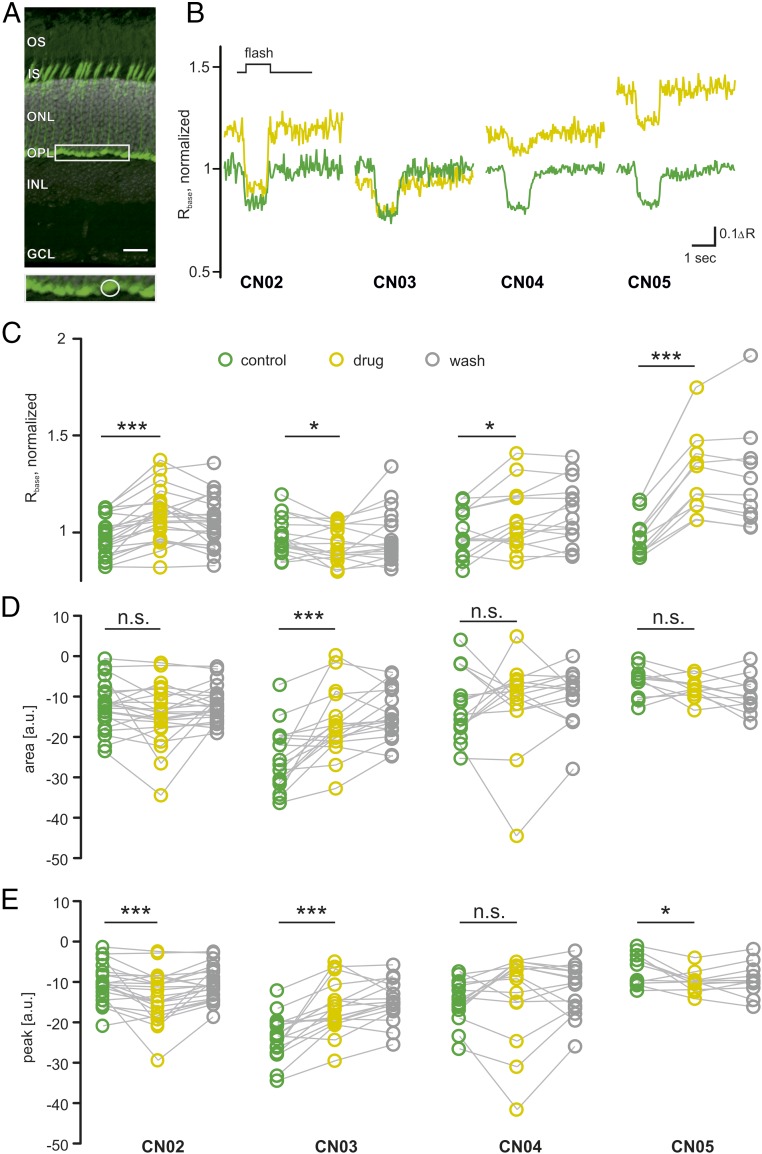
Effects of cGMP analogs on cone photoreceptor Ca2+ dynamics. (A) Vertical section of a mouse retina, expressing the TN-XL Ca2+ biosensor (below: magnification of cone terminals, indicated by box in top image). (Scale bar: 20 µm.) (B) Representative Ca2+ responses to light flashes before (green) and during application of 50 µM of the compound indicated below (yellow). (C) Compound-induced change in Ca2+ baseline (Rbase) measured in n = 23 cones in slices obtained from three animals (23/3) for CN02 (CN03, 18/3; CN04, 15/2; CN05, 11/2). Wash shown in gray. (D and E) Compound-induced changes in area under the curve, with negative values indicating larger response size (D), and peak height, with negative values indicating higher peaks (E; arbitrary units, a.u.). Statistical comparisons: C–E, not-treated WT vs. treated WT using Wilcoxon matched pairs, signed rank test. ΔR, amplitude; GCL, ganglion cell layer; INL, inner nuclear layer containing interneurons; IS, inner segments containing organelles of photoreceptors; ONL, outer nuclear layer containing rod and cone photoreceptor nuclei; OPL, outer plexiform layer; OS, outer segments of photoreceptor cells. n.s., P > 0.05; *P ≤ 0.05, ***P ≤ 0.001.

