Fig. 5.
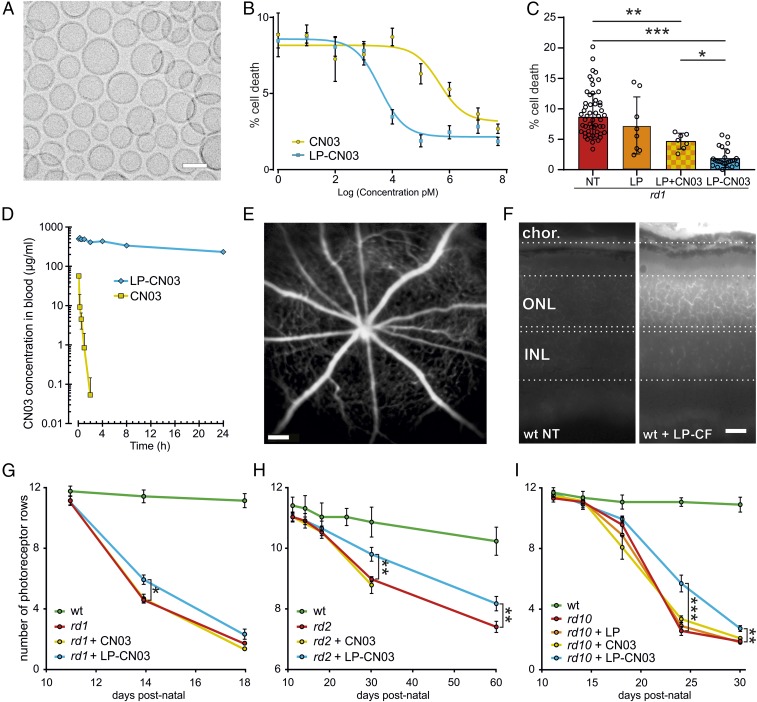
CN03 liposomal formulation improves neuroprotective efficacy. (A) Electron microscopy of GSH-PEG liposomes loaded with CN03 showing a vesicle size of ∼100 nm. (B) Neuroprotective effects of CN03 (yellow; EC50 = 400 ± 5 nM) and LP-CN03 (blue; EC50 = 3.5 ± 1 nM) in rd1 mutant photoreceptor-like cell cultures (n = 9 cell cultures from three independent preparations per concentration/treatment). (C) Cell death in NT rd1 photoreceptor-like cells (red bar), empty liposome treatment (LP, orange), coadministration of LP with free CN03 (LP+CN03, 1 µM; yellow/orange checkered), and LP-CN03 (1 µM). n = 8–62 different cell cultures from two to three independent preparations. (D) PK study in adult rats comparing in vivo half-life of free CN03 (10 min; yellow) vs. LP-CN03 (24 h; blue). n = 6 rats per group. (E) In vivo imaging using SLO. P10 WT mice were injected i.p. with carboxyfluorescein-loaded liposomes (LP-CF) and analyzed at P14. Fluorescent label was present mostly in retinal vasculature. (F) Cross-sections of P14 retinae from such LP-CF–treated animals displayed fluorescent labeling of choroidal blood vessels (chor.) but also of photoreceptors in ONL. (G–I) Three different in vivo RD mouse models were treated with CN03 (yellow), LP only (orange), or LP-CN03 (blue), beginning at the onset of degeneration (P10, rd1; P14, rd2 and rd10; cf. Table S2). Photoreceptor survival was assessed on ex vivo retinal tissue sections by counting photoreceptor rows in ONL. WT (green) shown for comparison. n = 4–8 animals (one eye per animal) per time point and genotype. (G) Progression of photoreceptor degeneration in rd1 animals (red) compared with rd1 animals treated with free CN03 (yellow) and LP-CN03 (blue). (H) Progression of degeneration in NT vs. LP-CN03–treated rd2 mice. (I) Progression of degeneration in NT (red) or LP-treated (orange) or CN03-treated (yellow) vs. LP-CN03 treated (blue) rd10 animals. Note different y axis scales in G–I to account for different degeneration kinetics. Error bars: SEM. Statistical comparisons: C, one-way ANOVA and Newman–Keuls multiple comparison test; G–I, Student’s t test (unpaired, two-tailed). INL, inner nuclear layer; NT, not treated. (Scale bars: A, 100 nm; E, 200 µm; F, 25 µm.) *P ≤ 0.05, **P ≤ 0.01, ***P ≤ 0.001.

