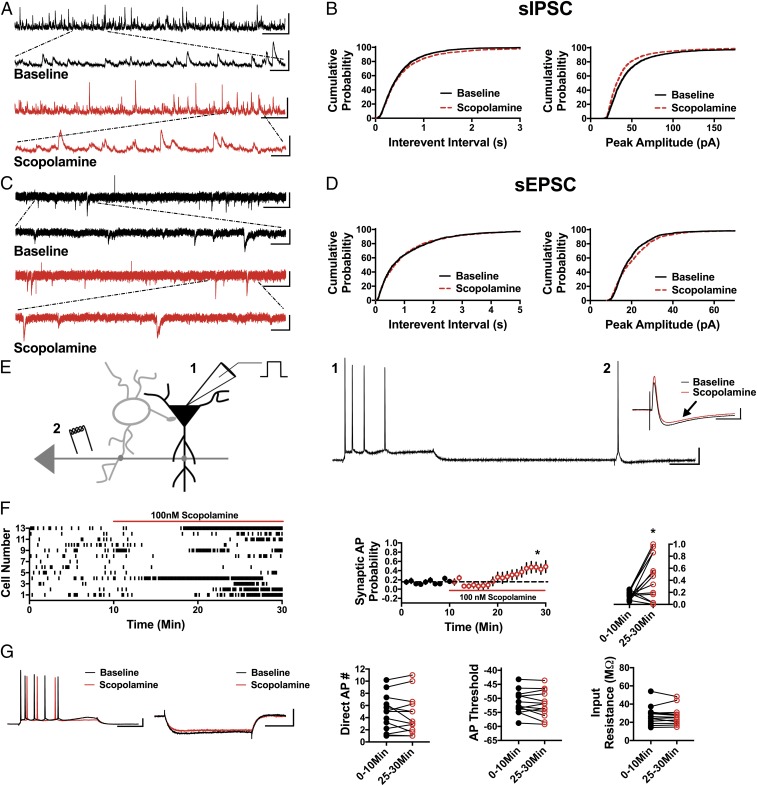
Fig. 4.
Scopolamine reduces sIPSC frequency and amplitude, increases sEPSC amplitude, and disinhibits CA1 pyramidal cells. (A) Representative traces showing scopolamine decreases sIPSC frequency and peak amplitude compared with baseline. (Scale bars: 100 pA and 5 s; Inset, 100 pA and 500 ms.) (B) Cumulative probability showing a significant increase in the sIPSC IEI in the presence of scopolamine (P < 0.05, n = 7, 2,700 baseline events, 2,500 scopolamine events) and a decrease in sIPSC peak amplitude (P < 0.0001, n = 7, 2,700 baseline events, 2,500 scopolamine events). (C) Representative traces from baseline conditions and in the presence of scopolamine. (Scale bars: 20 pA and 3 s; Inset, 20 pA and 500 ms.) (D) Cumulative probability showing no change in sEPSC IEI (P = 0.29, n = 5, 1,300 baseline events, 1,300 scopolamine events) and increased peak amplitude with bath application of scopolamine (P < 0.0001, n = 5, 1,300 baseline events, 1,300 scopolamine events). (E) Schematic of whole-cell recordings of CA1 pyramidal cells showing the effects of scopolamine on intrinsically (1) and synaptically (2) driven APs. (Scale bars: 20 mV and 100 ms.) (Inset) Representative subthreshold EPSP-IPSP traces from cell 12 in the raster plot; compared with the baseline trace (black), scopolamine decreases the IPSP magnitude (red trace, black arrow). (Scale bars: 2 mV and 50 ms.) (F) Raster plot and summary plots showing a significant increase in synaptic AP probability in the presence of scopolamine (*P < 0.05, n = 13). (G) No change in the measured intrinsic properties (Direct AP number, AP threshold, and input resistance) is observed (n = 13). (Scale bars: 20 mV and 100 ms, 4 mV and 100 ms.) All values are mean ± SEM.

