Fig. 5.
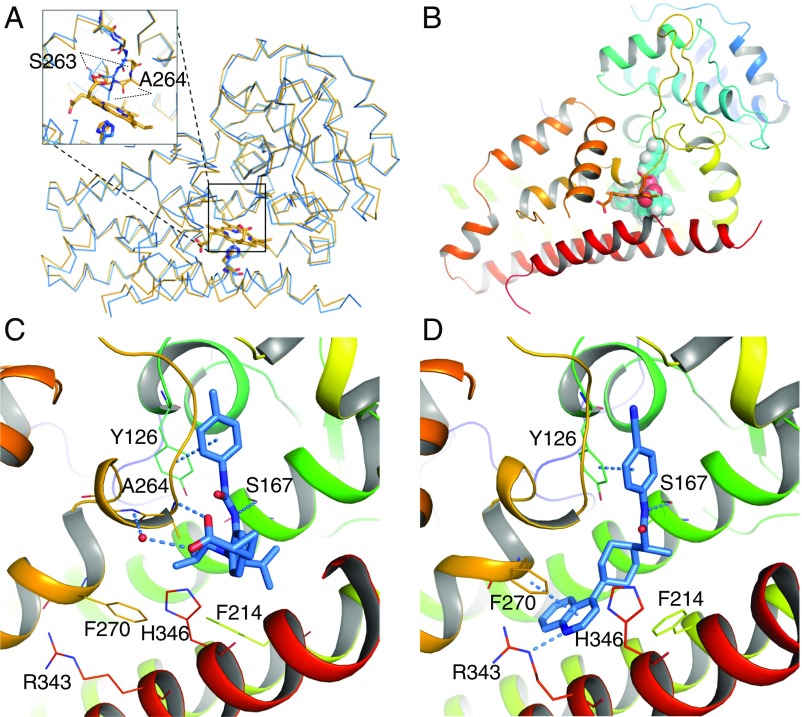
Structure of IDO1–inhibitor complexes. (A) Superposition of the backbone atoms of the crystal structures of IDO1 holoenzyme (orange) over that of IDO1/3 (blue). The overall structure of IDO1 undergoes little change on ligand binding. The loop corresponding to residues 260–265 is shifted, resulting in significant displacement (measured on Cα) of Ser-263 and Ala-264. Moreover, heme-coordinating residue His-346 is slightly rotated to interact with the ligand. (B) Sphere representation of 1 overlaid with heme shows that they bind IDO1 in a mutually exclusive manner. Binding geometries are shown for 1 in C and 3 in D. Structures were prepared from crystallographic coordinates using Maestro software to add hydrogens, determine protonation state of amino acid side chains, and minimize heavy atom deviation to a maximum of 0.3 Å from their crystallographic coordinates. Helix S (residues 383–399) is hidden in C and D for clarity. Figs. S4 and S5 depict the pocket rendering of holo-IDO1 in comparison with inhibitor-bound structures (Fig. S4), the electron density maps of inhibitors 1 and 3 bound to apo-IDO1 (Fig. S5), and 2D ligand interaction maps for 1 and 3 (Fig. S5).

