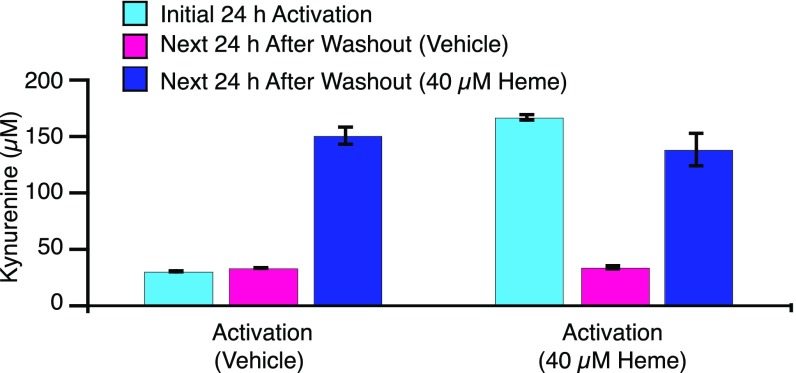
Fig. 6.
Kynurenine production by human SKOV3 ovarian tumor cells. Left depicts results from cells stimulated for 24 h with IFN-γ in the absence of added hemin. Right depicts cells stimulated with IFN-γ in the presence of 40 µM hemin. Blue bars depict kynurenine production after 24 h of IFN-γ stimulation. Cells were washed for 1 h with fresh media containing cycloheximide to halt protein synthesis. Kynurenine production was measured 24 h after addition of fresh media devoid of heme (pink) or containing 40 µM hemin (dark blue). Error bars represent SD.

