Fig. 5.
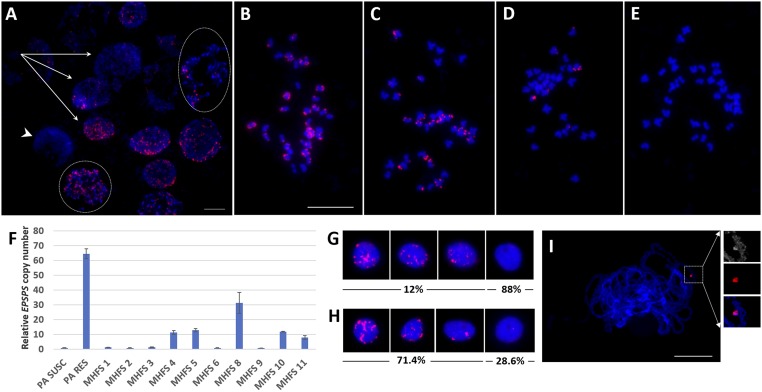
Inheritance and soma cell heterogeneity of eccDNAs and EPSPS copy number in F1 plants of GS A. palmeri x GR A. palmeri, including cells lacking eccDNAs (arrowheads) in a single root tip meristem. (A) Variable number of eccDNA FISH signals (red) in interphase and prometaphase stages (circles). (B–E) Different metaphase cells showing variable numbers of eccDNAs, including no eccDNAs (E). (F) Average EPSPS copy numbers of F1 plants and the controls. The y axis represents the relative β-tubulin/EPSPS gene copy number. (G) FISH analysis on nuclei isolated from leaf tissue of plant MHFS 1. (H) FISH analysis on nuclei isolated from leaf tissue of plant MHFS 8 showing variable eccDNA signals. Note that 12% (n = 100) (G) and 71.4% (n = 70) (H) indicate the percentages of different cells having eccDNA associated with FISH-positive nuclei in plants MHFS 1 and MHFS 8, respectively. (I) Pachytene FISH showing anchoring of an eccDNA on pachytene chromosomes in plant MHFS 1. (Scale bars, 10 μm.) Insets, Top, 2× enlarged and pseudo-colored DAPI image showing association of an eccDNA to pachytene chromosome; Middle, FISH labeled eccDNA; Bottom, merged image of top and middle.

