Fig. 1.
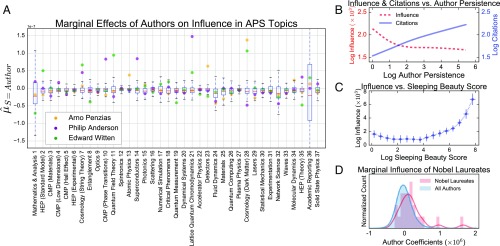
(A) Box plots of author coefficients for each APS topic. Medians are shown as a red line within each box, the first quartiles are within the box, and the second and third quartiles are within bands. CMP, condensed matter physics; HEP, high energy physics. Note the wider distributions for more general topics 1 and 36. Overlaid are coefficients for three physicists. Positive values mean that an author’s byline adds influence, whereas a negative value means it detracts. A positive coefficient does not necessarily mean that a document is highly influential itself, only that it was more influential than if it had it been written by the average author. (B) Locally weighted scatter plot smoothing (LOWESS) curves comparing document influence (dashed red line; left y axis) and citations (solid blue line; right y axis) with author persistence (Eq. 11) (x axis). A consistent and statistically significant trend is established: more persistent authors tend to produce more highly cited but less influential documents, whereas less persistent authors have more influential but less cited documents. (C) LOWESS curve fit to the plot of documents’ influence vs. their SB score. Error bars are 2 SE of the mean in both dimensions. (D) Distribution of authors’ marginal effect on influence for Nobel Laureates compared with all other authors.

