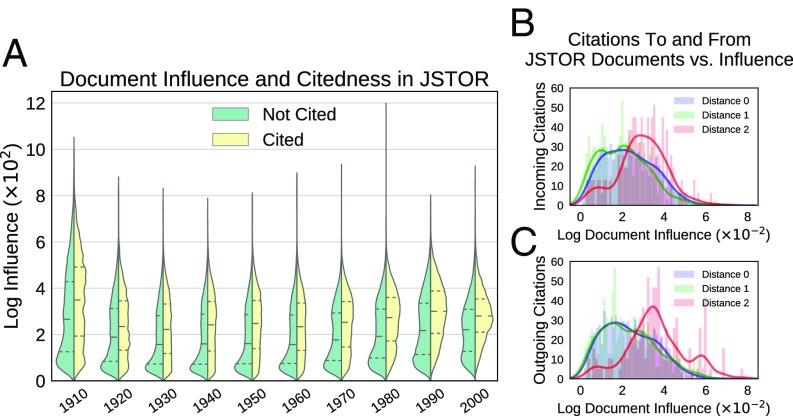
Fig. 4.
(A) Violin plot of document influence (y axis; kernel density estimate bandwidth = 0.1) for cited and uncited documents in JSTOR grouped by decade; 2010 is omitted as incomplete. (B and C) Histograms and density estimates of (B) incoming and (C) outgoing citations among JSTOR documents grouped by distance in the subject tree.

