Fig. 2.
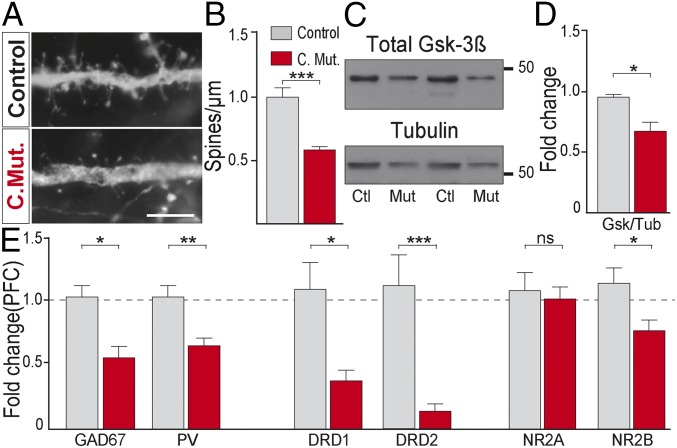
PFC endophenotypes in conditional DRD2 mutants. (A) Micrographs of dendritic spines from pyramidal neurons of control and conditional DRD2 mutant animals. (Scale bar: 5 µm.) (B) Quantification of dendritic spine density (n = 7–9 dendrites from three animals from each genotype). (C) Immunoblots from PFC homogenates in control and conditional DRD2 mutant mice of total Gsk3β and Tubulin and (D) their respective quantification (n = 5–6 animals each genotype). (E) mRNA fold change (n = 5–8 animals from each genotype) for GAD67, PV, DRD1, DRD2, NR2A, and NR2B in PFC. *P < 0.05, **P < 0.01, ***P < 0.001; ns, not significant. Data are presented as mean ± SEM. Unpaired t test (B, D, and E).

