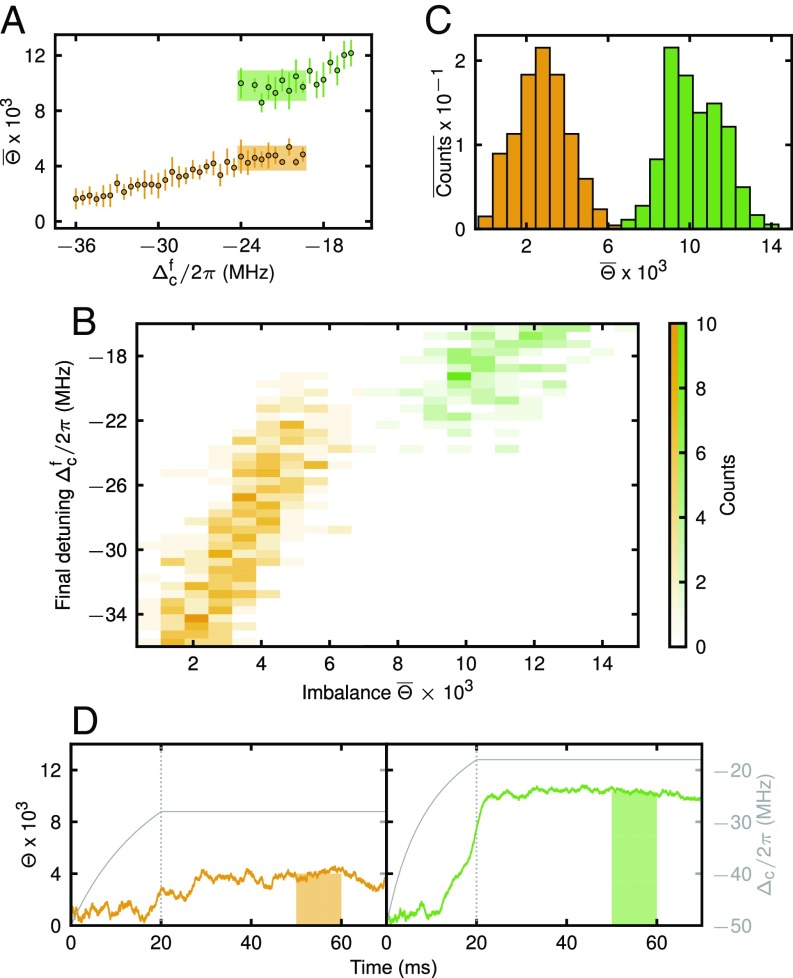
Fig. 2.
Metastability measurement. Shown is the observation of two distinct steady-state imbalances , shown in orange and green, and exemplary time traces. We prepare an MI and then quench the detuning from MHz to closer to resonance within ms, increasing . (A) Mean values of the imbalance . Errors are SD. The imbalance is separated by a gap of atoms into two levels. (B) Histogram as a function of and with bin sizes of atoms in and MHz in . (C) Histogram of the normalized sum of all counts with respect to . For the normalization see Evaluation of the Metastability Measurement. (D) Exemplary time traces for quenches ending at MHz (Left) and MHz (Right). The shaded regions indicate where the averaged imbalance is extracted. This experiment was performed with atoms at maximum lattice depths of .

