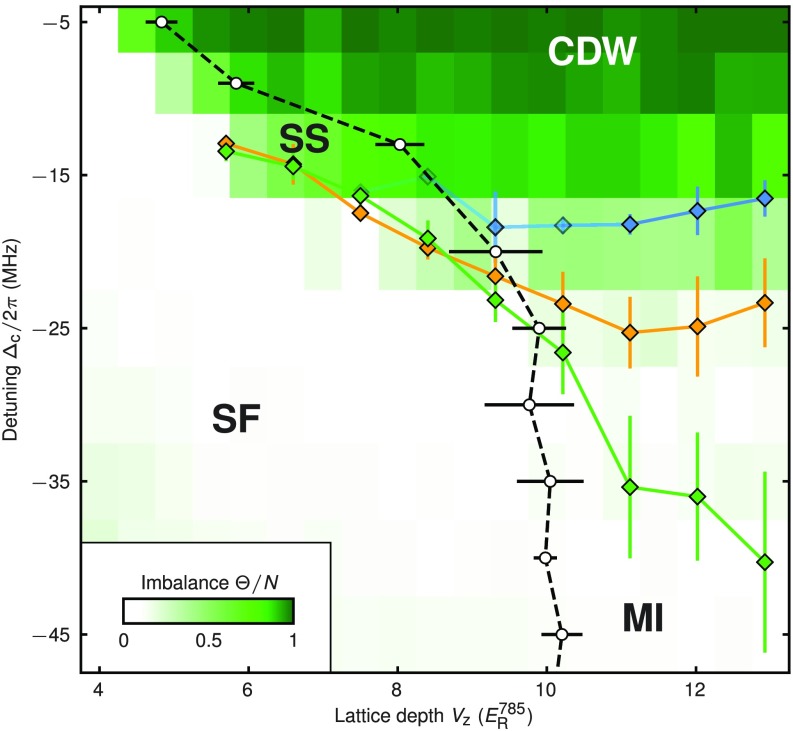
Fig. 6.
Previously extracted transition points superimposed on a phase diagram of the system. Results from the hysteresis measurement: Orange and green diamonds indicate the thresholds where an imbalance is created and where it vanishes during detuning ramps, respectively. The center of the imbalance jump is shown in blue, where transparency indicates the probability of occurrence of the jump. For details on the measurement of the phase diagram, see Phase Diagram Measurement: Data Evaluation. White data points and the associated black dashed line indicated the loss of coherence, from left to right, which we infer from the measured BEC fraction, and green tiles indicate states with nonzero imbalance. We identify a superfluid (SF), a lattice supersolid (SS), an MI, and a CDW phase. This experiment was performed with atoms at maximum lattice depths of . For further details see ref. 23 and Phase Diagram Measurement: Data Evaluation. Error bars are SD (Phase Diagram Measurement: Data Evaluation and Fig. S4).

