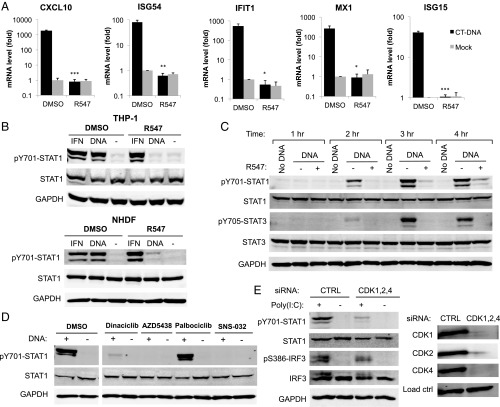
Fig. 1.
Inhibition of CDK activity prevents nucleic acid-induced ISG induction and STAT1 activation. (A) THP-1 cells were treated with the CDK inhibitor R547 (10 nM) or DMSO, and transfected with DNA (4 µg/mL) or mock. mRNA levels for the indicated genes were quantified by qRT-PCR 4 h posttransfection, and are presented relative to GAPDH mRNA levels. Values presented are the average of at least three independent experiments, error bars represent the SEM, statistical significance was determined by unpaired Student’s t test: *P < 0.05, **P < 0.01, ***P < 0.001, n.s. not significant. (B) THP-1 and NHDF cells were challenged with DNA (4 µg/mL) or IFN-α (10 U/mL) with R547 or DMSO. Total cell lysates were collected 2 h later and analyzed by Western blot with the indicated antibodies. (C) THP-1 cells were treated with R547 or DMSO and transfected with DNA (4 µg/mL) or mock. Total cell lysates were collected at the indicated time points, and analyzed by Western blot. (D) THP-1 cells were treated with CDK inhibitors R547 (10 nM), dinaciclib (10 nM), AZD-5438 (50 nM), palbociclib (50 nM), SNS-032 (100 nM), or DMSO, and transfected with DNA. Lysates were analyzed as in B. (E) NHDF primary fibroblasts were transfected with siRNAs for CDKs 1, 2, and 4, or a nontargeting control. Knockdown levels of CDKs 1, 2, and 4 were determined at the protein level (Right). Cells were challenged with poly(I:C) (4 µg/mL), and lysates were collected 2.5 h later and analyzed by Western blot (Left) for STAT1 and IRF3 activation.

