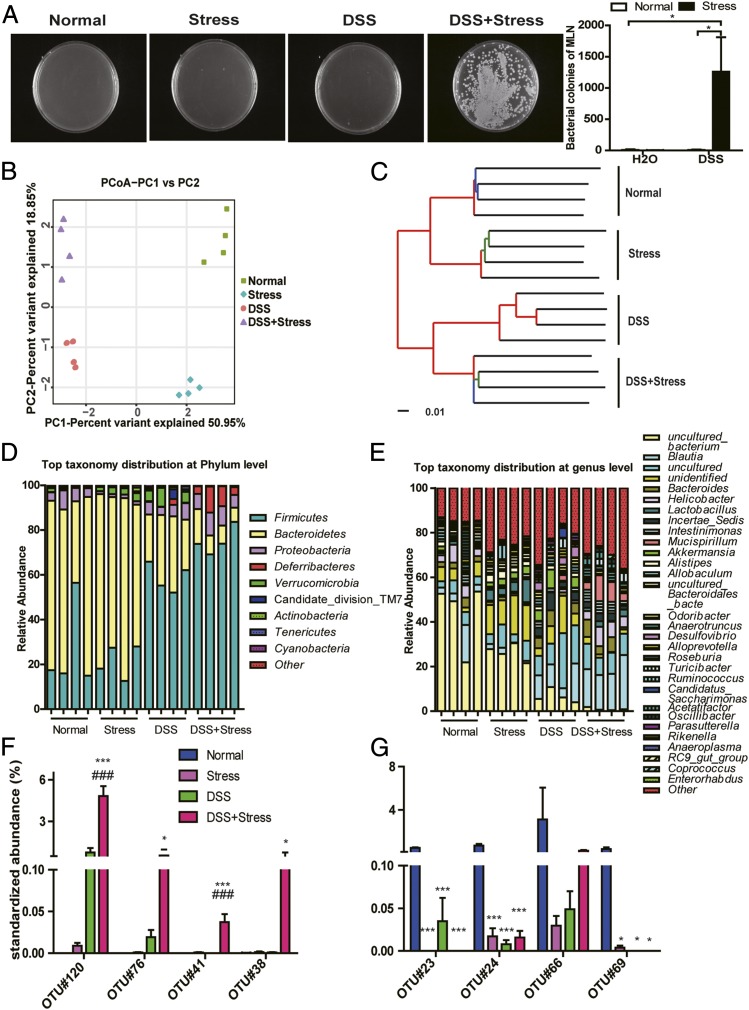
Fig. 4.
Chronic stress changed composition of gut microbiota and degraded the colonic mucus barrier. (A) Representative images and numbers of bacterial colonies in MLN (n = 4; *P < 0.05). (B) PCoA (n = 4). (C) UPGMA method (n = 4). (D) Composition of microbiota at phylum level (n = 4). (E) Composition of microbiota at genus level (n = 4). (F) Bacterial species from colon content that had the greatest increase in abundance between different groups and their relative abundance. OTU#120 is related to Helicobacter, OTU#76 to Peptostreptococcaceae, OTU#41 to Streptococcus, and OTU#38 to E. faecalis (n = 4). (G) Bacterial species from colon content that had the greatest decrease in abundance between different groups and their relative abundance (*P < 0.05 and ***P < 0.001 vs. normal group; ###P < 0.001 vs. DSS group). OTU#23 is related to Rikenella, OTU#24 to Rikenella, OTU#66 to Roseburia, and OTU#69 to Lachnospiraceae bacterium 6-1 (n = 4).

