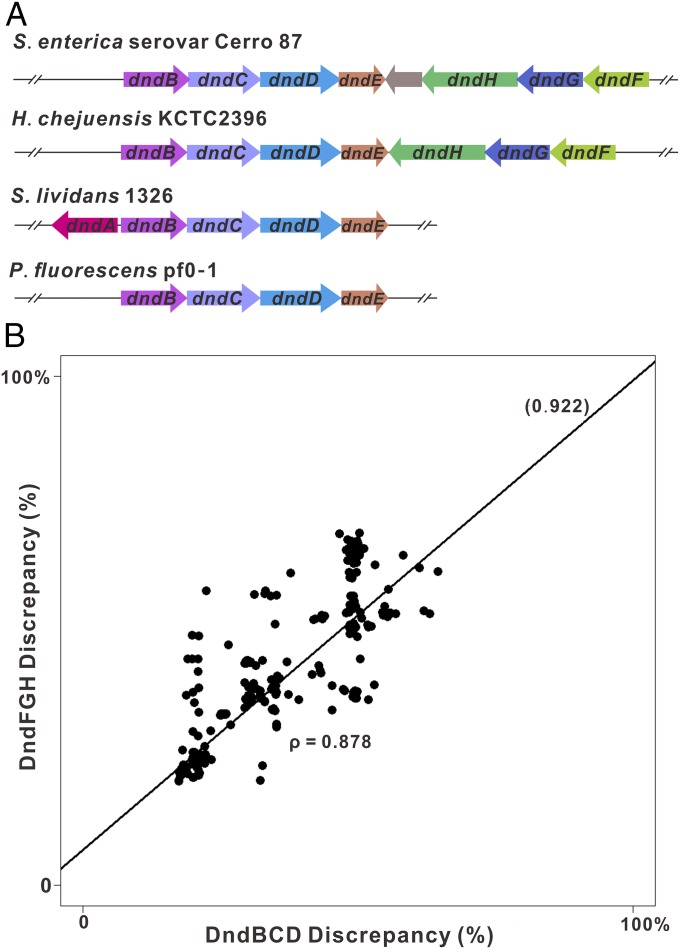
Fig. 2.
Scatterplot of alignment distances of PT M and R genes in 734 complete PT R-M pairs in response to queries. (A) Four typical PT R-M and PT R−-M+ systems are displayed. The DndBCD and DndFGH sequences of S. enterica serovar Cerro 87 and H. chejuensis KCTC2396 were used as queries for BLAST searches. (B) Many strains have identical values for the two distances, and thus overlap. The high coefficient correlation, ρ = 0.878, suggests the coevolution of the M and R components in DNA PT systems.

