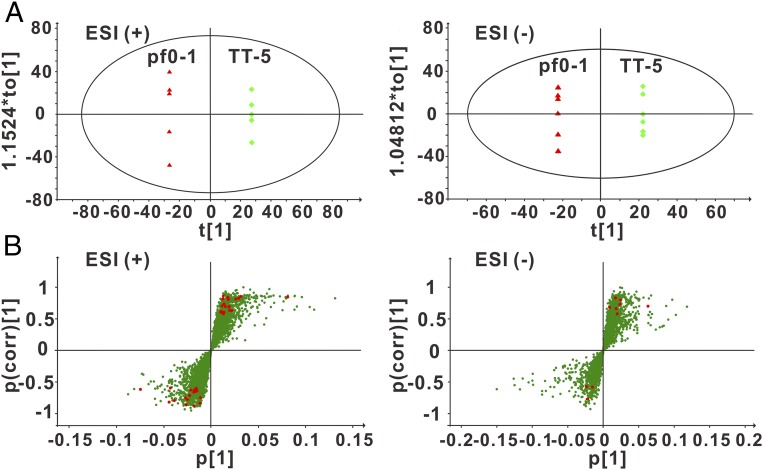
Fig. 5.
Identification of discriminatory metabolites from pf0-1 and TT-5. (A) OPLS-DA score plot derived from the UPLC-ESI-Q-TOF-MS metabolomic analysis showed the differential clustering of pf0-1 and TT-5 in both the positive and negative modes. (B) S-plot represents the impact of the metabolites on the discriminative clustering of pf0-1 and TT-5. All 48 metabolites with VIP > 1 and P < 0.05 are marked with red circles. These metabolites lie in the upper right and lower left quadrants, showing high contribution and correlation to the discrimination of the metabolomes of pf0-1 and TT-5.

