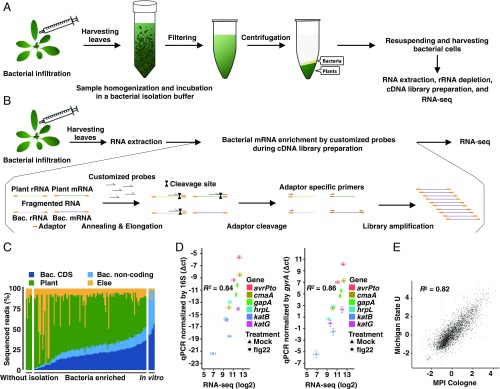
Fig. 1.
Establishment of in planta Pto transcriptome analysis. (A) Workflow of in planta bacterial transcriptome analysis based on bacterial isolation (see Materials and Methods for further information). (B) Workflow of in planta bacterial transcriptome analysis based on selective depletion of plant-derived transcripts (see Materials and Methods for further information). (C) The ratio of sequenced reads mapped on the bacterial (Bac) CDS, bacterial noncoding sequence, A. thaliana (Plant) genome, and sequence reads that mapped to neither the Pto nor the A. thaliana genome (Else) in all samples, including samples without bacterial enrichment and in vitro samples. (D) Validation of RNA-seq data by RT-qPCR. Four-week-old A. thaliana leaves were pretreated with 1 μM flg22 or water (Mock) 1 d before infection with Pto (OD600 = 0.5) and were harvested at 6 hpi. The samples were split into two. One sample was subjected to direct RNA extraction followed by RT-qPCR analysis, and the other was subjected to bacterial enrichment followed by RNA-seq. RT-qPCR results were normalized with the Pto 16S or gyrA expression (mean ± SEM; n = 4 biological replicates from four independent experiments). RNA-seq data were processed as described in Materials and Methods (mean log2 count per million ± SEM; n = 4 biological replicates from four independent experiments). Pearson correlation coefficients (R2) are shown. (E) Comparison of log2 fold changes in Pto gene expression in flg22-pretreated plants and mock-pretreated plants based on RNA-seq data independently obtained by two different approaches in two different laboratories: The method based on bacterial isolation from infected plants [Max Planck Institute Cologne (MPI), x axis] and on bacterial mRNA enrichment using customized oligonucleotides to remove abundant plant RNA without bacterial isolation [Michigan State University (U), y axis]. The Pearson correlation coefficient is shown. See Materials and Methods for detailed experimental procedures.

