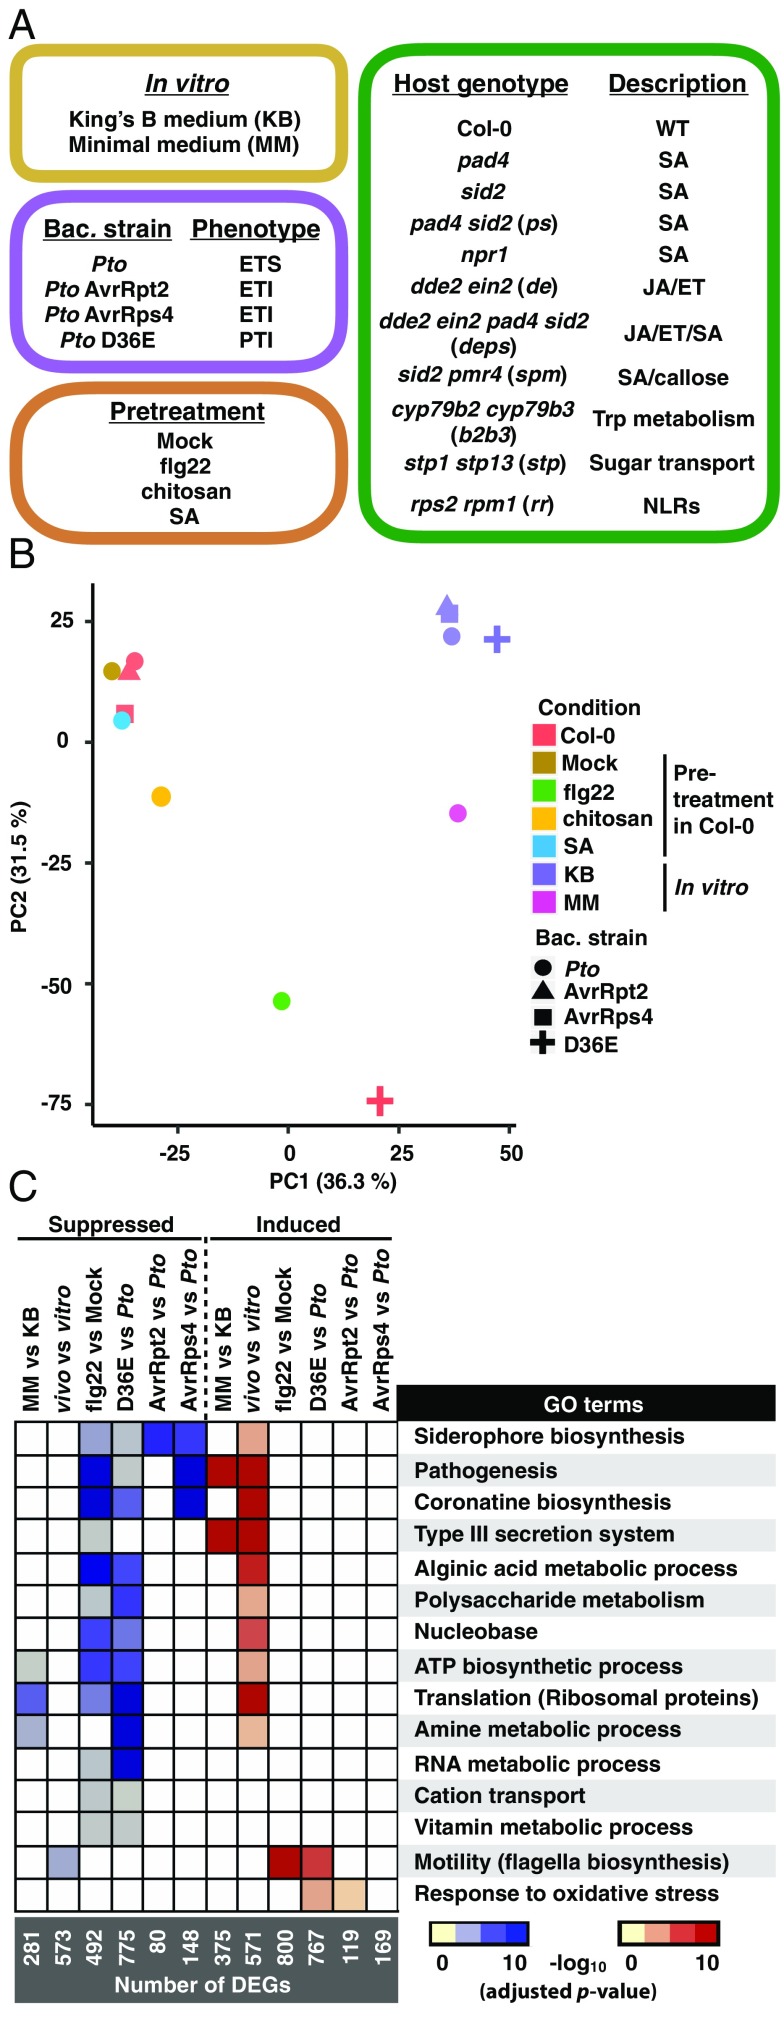
Fig. 2.
Profiles of the Pto transcriptome under various conditions. (A) Plant genotypes, bacterial (bac.) strains, and conditions used in this study. For the full sample list, see Dataset S1. ET, ethylene; ETI, effector-triggered immunity; ETS, effector-triggered susceptibility; JA, jasmonic acid; NLRs, nucleotide-binding domain leucine-rich repeat proteins; PTI, pattern-triggered immunity; Pto, Pseudomonas syringae pv. tomato DC3000; SA, salicylic acid; Trp, tryptophan. (B) Principle component analysis of 3,344 genes detected in all samples. (C) Heatmap of −log10 P values (adjusted by the Benjamini–Hochberg method) of GO terms representing the DEGs in different comparisons. KB, Pto in King’s B medium; MM, Pto in MM medium; vitro, Pto in King’s B medium; vivo, Pto infection in Col-0. For the list of differentially expressed genes and complete enriched GO terms, see Datasets S2 and S3, respectively.

