Fig. 3.
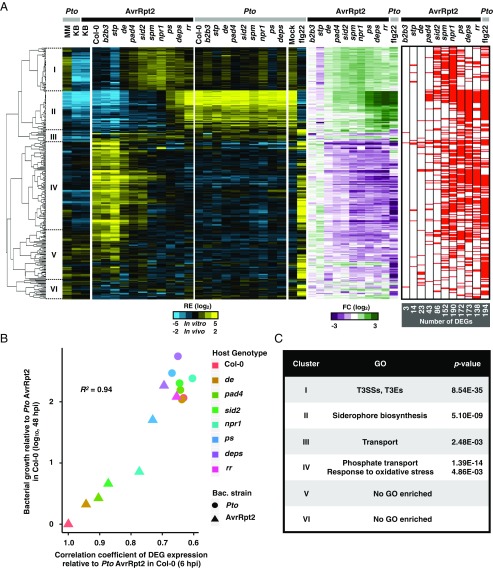
Host genotype effects on bacterial transcriptome. (A, Left; blue/yellow heatmap) Hierarchical clustering of the relative expression (RE) of the DEGs in Pto AvrRpt2 based on the pairwise comparisons between Col-0 plants and the mutant plants (FDR < 0.01; |log2 fold change| > 2; represented by the red marks in the heatmap on the Right). (Middle; green/magenta heatmap) Fold changes in Pto AvrRpt2 gene expression in defense-mutant plants compared with those in Col-0 plants or fold changes in Pto in flg22-pretreated Col-0 plants compared with mock-pretreated Col-0 plants. Pto and Pto AvrRpt2 are represented by gray and black marks, respectively. See Dataset S4 for the list of DEGs. (B) The relationship between the expression pattern of the bacterial DEGs at 6 hpi and bacterial growth at 48 hpi. The Pearson correlation coefficient is shown (R2 = 0.94). The genes of Pto AvrRpt2 identified as DEGs in at least one of the pairwise comparisons between Col-0 and mutant plants (FDR < 0.01; |log2 fold change| > 2) were used for the analysis. The x axis represents Pearson correlation coefficients of DEG expression patterns between each sample and Pto AvrRpt2 in Col-0 plants. The y axis represents increased bacterial growth levels in each sample compared with Pto AvrRpt2 in Col-0 plants at 48 hpi (29). (C) List of GO terms enriched in the clusters shown on the left of the dendrogram in A. For the full GO list, see Dataset S5. See Fig. 2A for the acronyms.

