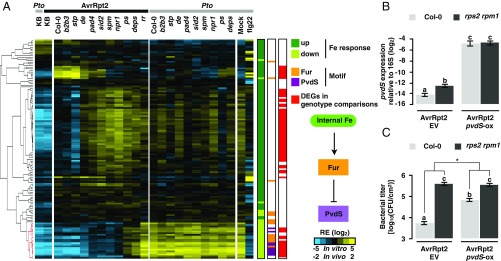
Fig. 4.
Iron-related genes of Pto are targeted by plant immunity. (A) Hierarchical clustering of the relative expression (RE) of Pto genes previously reported as iron responsive (39). Iron-inducible and iron-repressive genes are represented by dark and light green marks, respectively (P < 0.05). The red marks represent Pto AvrRpt2 genes differentially expressed in at least one of the pairwise comparisons between Col-0 plants and the defense-mutant plants. Binding motifs of Fur and PvdS are represented by orange and purple marks, respectively. Pto and Pto AvrRpt2 are represented by gray and black marks, respectively. (B) RT-qPCR analysis of pvdS expression of Pto AvrRpt2 carrying an empty vector (EV) or Pto AvrRpt2 pvdS-ox (OD600 = 0.5) normalized to 16S in Col-0 or rps2 rpm1 plants at 6 hpi. (C) Growth of Pto AvrRpt2 EV or Pto AvrRpt2 pvdS-ox (OD600 = 0.001) in Col-0 or rps2 rpm1 plants at 48 hpi. In B and C, the mean ± SEM was calculated by using a mixed linear model (B: n = 4 biological replicates from four independent experiments, C: n = 72 and 48 biological replicates from six and four independent experiments for Col-0 and rps2 rpm1, respectively). Different letters indicate statistically significant differences (adjusted P < 0.01; Benjamini–Hochberg method). The asterisk indicates a statistically significant difference in the host genotype effect in the bacterial strains (P = 6.61E-08; two-tailed Student’s t test).

