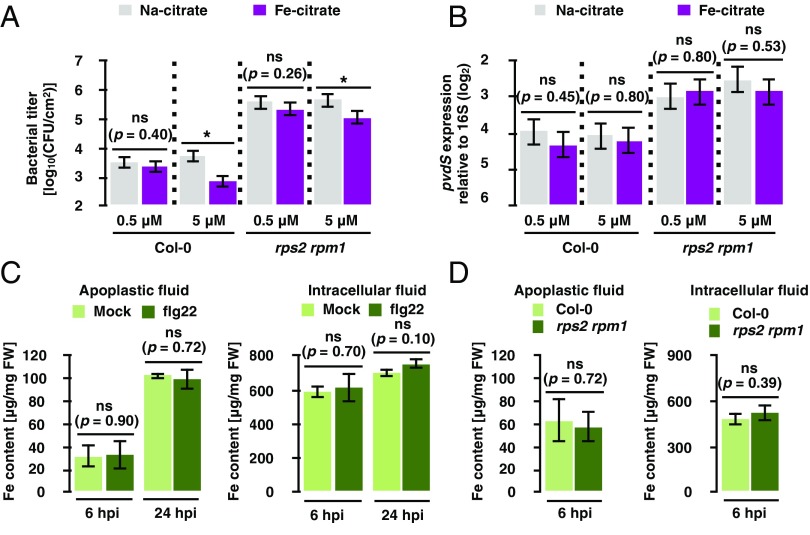
Fig. 5.
Iron content in the apoplast does not explain pvdS expression and Pto growth. (A) Growth assay of Pto AvrRpt2 in Col-0 and rps2 rpm1 plants at 48 hpi. The bacterial suspension (OD600 = 0.001) was coinfiltrated with Na-citrate or Fe-citrate. (B) RT-qPCR analysis of pvdS expression in Pto AvrRpt2 in Col-0 and rps2 rpm1 plants at 6 hpi. Bacterial suspension (OD600 = 0.5) was coinfiltrated with Na-citrate or Fe-citrate. Error bars in A and B represent means and SEs calculated from independent experiments using a mixed linear model (A: n = 3, B: n = 6). Asterisks indicate statistically significant differences (adjusted P value < 0.01). ns, not significant (adjusted P values are shown). (C) Iron content in apoplastic and intracellular fluids extracted from Col-0 plants sprayed with 1 μM flg22 or water (Mock) at the indicated time points. (D) Iron content in apoplastic and intracellular fluids extracted from Col-0 or rps2 rpm1 plants infiltrated with Pto AvrRpt2 (OD600 = 0.5). Error bars in C and D represent means and SEs calculated from three independent experiments. ns, not significant (P values are shown; two-tailed Student’s t test).

