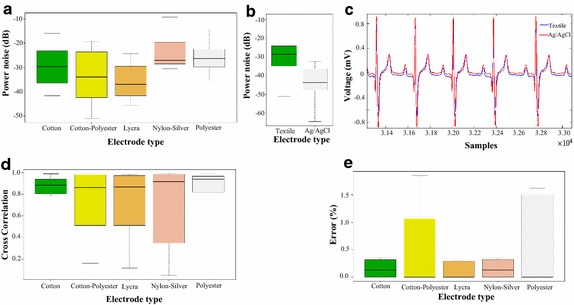
Fig. 10.

Noise measurements. a Box and whisker plot of the average noise power quantified from a filtering process. b Box and whisker plot of the average noise power comparing textile vs Ag/AgCl electrodes. c Plot of the average Pearson cross-correlation coefficient calculated between ECG signals acquired simultaneously (textile vs Ag/AgCl). d Segment of an ECG signal simultaneously recorded with textile (blue) and Ag/AgCl (red) electrodes. e Average percentage of error in the detection of ECG signal segments.
