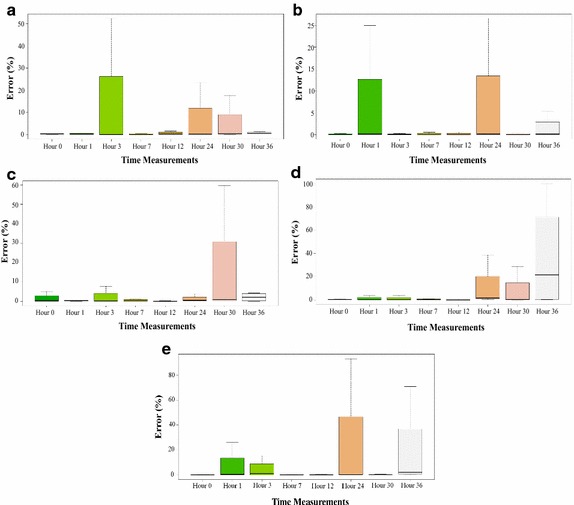
Fig. 11.

Long-term performance: segmentation error percentage versus time. Each one of the box diagrams represents the percentage of error in the determination of ECG signals of the textile electrodes with respect to the commercial electrodes, in the different measurement time periods. Most of the graphs show that the median of the measurements is below 5%. a Cotton electrodes. b Cotton–polyester electrodes. c Lycra electrodes. d Nylon–silver electrodes. e Polyester electrodes.
