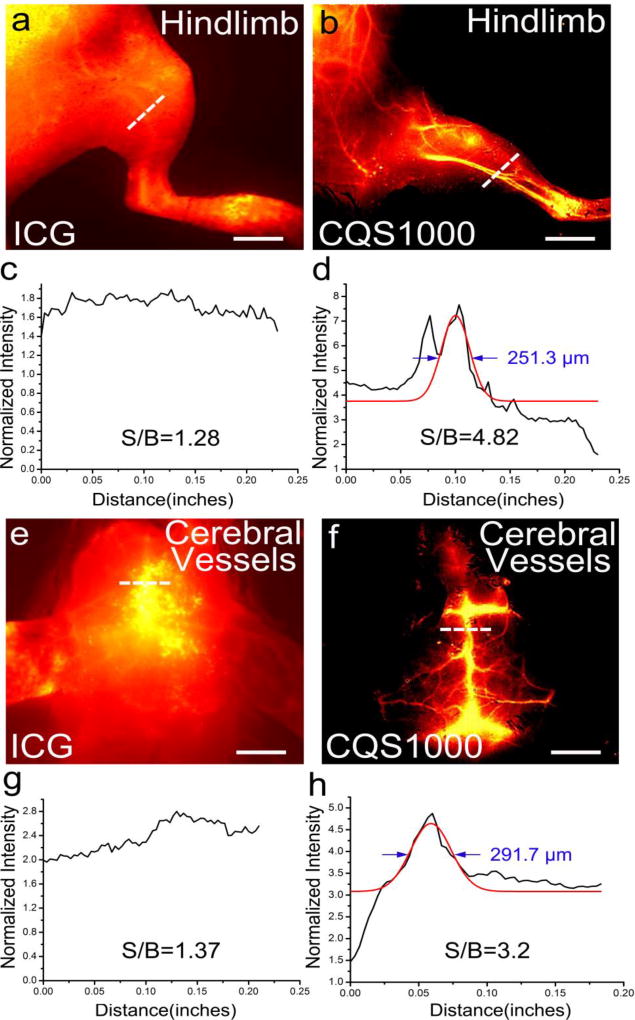
Figure 3. Fluorescence images of the vasculature of hind limb and brain in C57BL/6 mice using CQS1000(NIR-II) and ICG (NIR-I).
In vivo fluorescence vascular image showing hind limb(femoral artery) and cerebrovascular vessels in the NIR-I (ICG) and NIR-II (CQS1000) regions in C57BL/6 mice shown in (a, b, e, f), with the vessel FWHM width and SBR (white lines in a, b, e, f) analysis shown in (c, g) (failed to acquire because of the broadened peak of signal), (d) and (h), respectively, basing on the cross-sectional intensity profiles. Scale bar: 1.5 cm.

