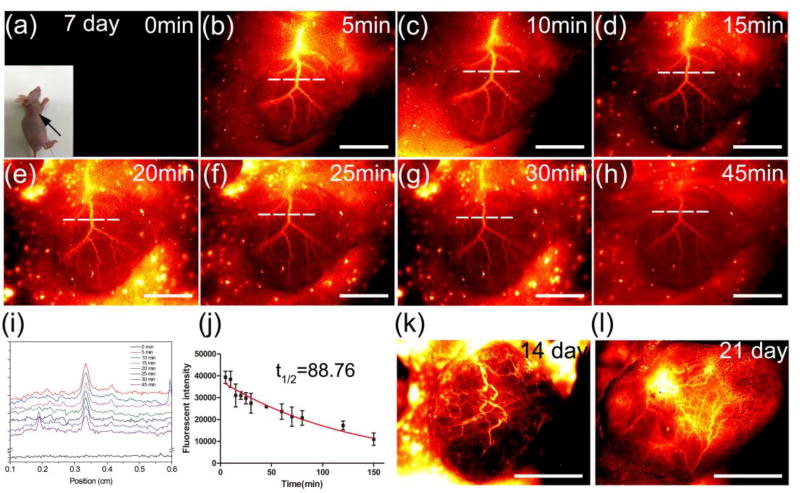
Figure 4. In vivo dynamic assessment of angiogenesis development of tumor.
NIR-II fluorescence images were captured on the 143B osteosarcoma tumor-bearing mouse every 5 minutes after the CQS1000 injection intravenously (a)–(h). (i). A series analysis of cross-sectional intensity profile measured along the white-dashed line in (a)–(h). (J). A fluorescent intensity analysis representing the intersection point with white-dashed line and the major artery supporting the tumor in (a)–(h), and the half - life of blood circulation was calculated as 88.76 min. (k) and (l). Fluorescent images captured on 14 and 21 days after the 143B osteosarcoma inoculation on nude mice, respectively, indicating the disorganized and tortuous pattern of blood vessel in tumor. Scale bar: 4mm.

