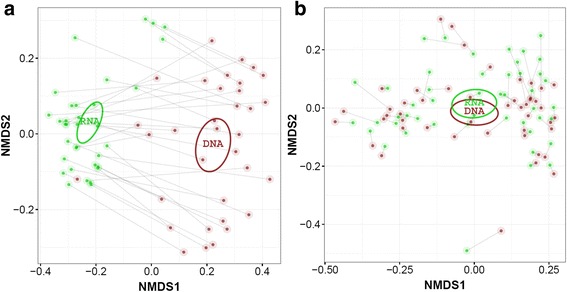
Fig. 3.

Non-metric distance scaling (NMDS) analysis of the unweighted UniFrac distance indices of the a archaeal and b bacterial community at OTU level. The DNA (red)-and RNA (green)-based community profiles of the same samples were connected by means of a grey line. The circles represent the 95% value of the standard error of the average value of the DNA (red) and RNA (green) indices
