
Figure 1.
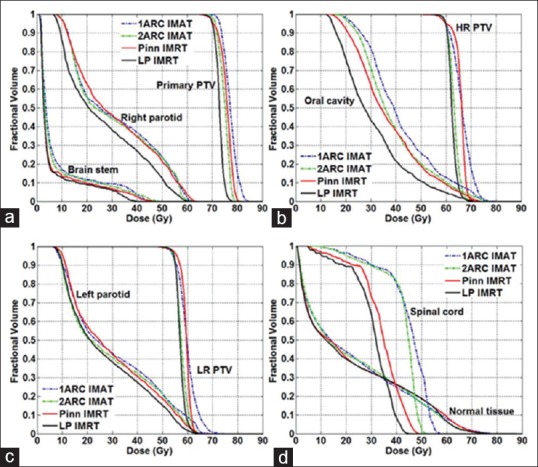
Mean dose–volume histogram comparisons in 10 head-and-neck cases for: (a) Primary planning treatment volume, brain stem, and right parotid; (b) High-risk planning treatment volume and oral cavity; (c) Low-risk planning treatment volume and left parotid; and (d) Spinal cord and normal tissue for intensity-modulated radiation therapy and volumetric-modulated arc therapy plans