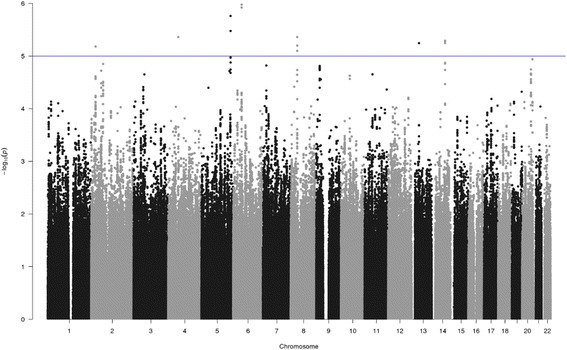
Fig. 1.

pQTL analysis of SNPs associated with circulating ANGPTL3 at baseline. Manhattan plot of pQTL analysis of SNPs associated with circulating ANGPTL3 at baseline. Each SNP is indicated by a black or a gray dot. They are arranged by chromosomal location (x-axis). The y-axis illustrates the level of statistical significance measured by the negative log of the corresponding p value for each SNP. The blue line represents suggestive association (p < 1 × 10⁻⁵)
