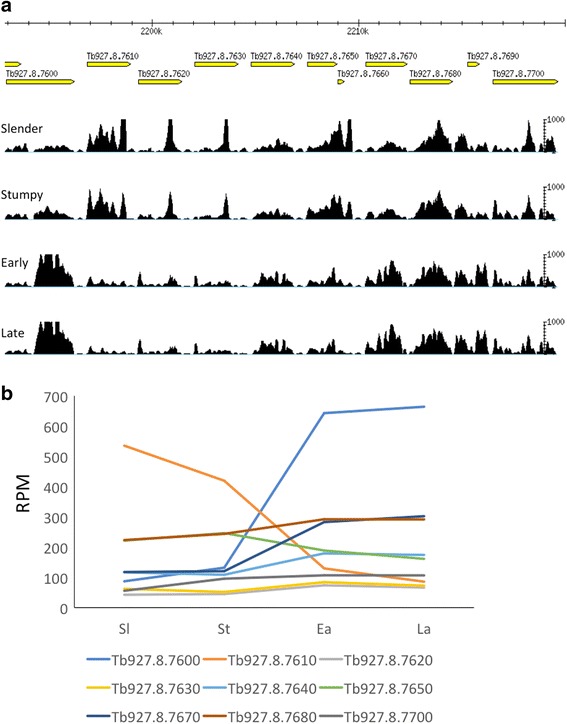
Fig. 6.

Cluster of amino acid transporters showing differential expression. a Gbrowse image showing mapping coverage of the locus. b Expression profiles of individual genes in successive life-cycle stages. Y-axis, reads per million (RPM). The coding region of Tb927.8.7610 is ≥96% identical to Tb927.8.7630/7640, but their expression profiles are distinct. Sl: slender bloodstream forms; St: stumpy bloodstream forms; Ea: early procyclic forms; La: late procyclic forms
