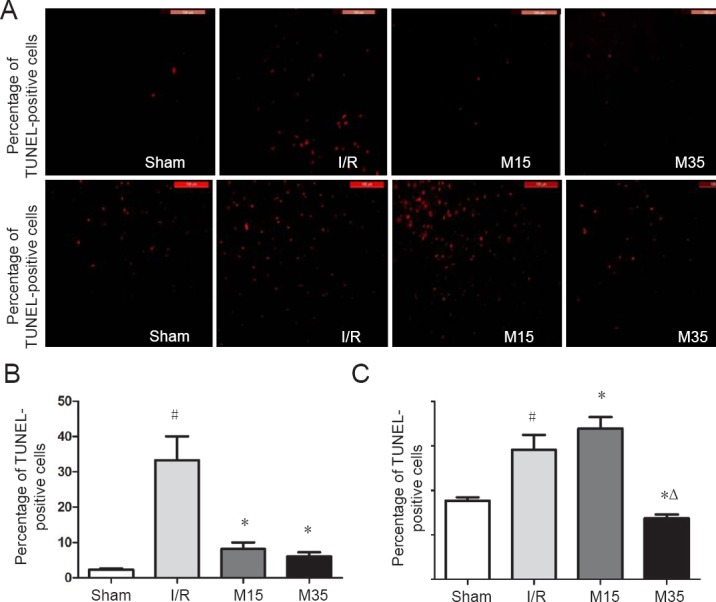
Figure 4.

Immunofluorescence labeling for caspase-9 and caspase-3 in the injured rat cortex.
Brain slices were prepared 3 days after sham surgery or after I/R (2 hours of middle cerebral artery occlusion followed by 3 days of reperfusion). (A) Immunofluorescence images of caspase-9 and caspase-3 labeling in the cortex 3 days after I/R. Caspase-positive cells were stained red. Scale bars: 100 μm. Quantitative analysis of the number of caspase-9-positive cells (B) and caspase-3-positive cells (C). The numbers of caspase-positive cells were counted in five random high-power fields (200×) and are presented as the mean ± SEM (n = 3) and analyzed using one-way analysis of variance followed by Dunnett's test. #P < 0.05, vs. sham group; *P < 0.05, vs. I/R group; ΔP < 0.05, vs. M15 group. Sham: Sham surgery group; I/R: I/R group; M15: 15-minute moxibustion group; M35: 35-minute moxibustion group.
